US Dollar breaks support with impulsive price action - Your capital is at risk
http://www.admiralmarkets.com/analyt...e-price-action
EUR/USD
4 hour
https://fxmedia.s3.amazonaws.com/art...09-2016eu4.png
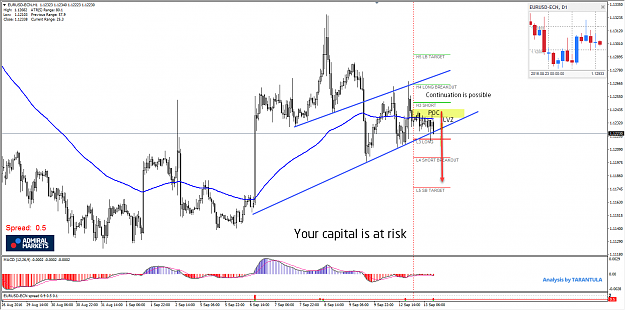
The EUR/USD bounced at the support trend line (dark green) as indicated in yesterday's wave head line, but rallied with such a bullish momentum that a larger bullish ABC (blue) is probably taking place. Price is in a wave X (purple) unless it manages to break above resistance (red) and the top Fibonacci levels.
1 hour
https://fxmedia.s3.amazonaws.com/art...09-2016eu1.png
The EUR/USD momentum is most likely a wave 3 (green) within the wave C (blue). A wave 4 (green) pullback could see support at the Fibonacci levels.
GBP/USD
4 hour
https://fxmedia.s3.amazonaws.com/art...09-2016gu4.png
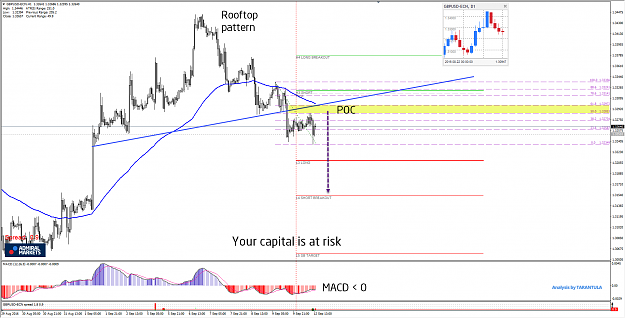
The GBP/USD is an ABC zigzag correction (green/pink) that is taking place in a bullish channel. The Fibonacci levels could be targets for the C wave.
1 hour
https://fxmedia.s3.amazonaws.com/art...09-2016gu1.png
The GBP/USD also showed a bullish bounce as indicated by yesterday's headline. The subsequent momentum seems to be a wave 3 (purple) and a retracement could meet support at the Fibonacci levels of wave 4 (purple) vs 3.
USD/JPY
4 hour
https://fxmedia.s3.amazonaws.com/art...09-2016uj4.png
The USD/JPY indeed completed a head and shoulders reversal pattern (3 purple circles) after which it broke below support (dotted green). A strong bearish momentum unfolded during yesterday's trading that took price down to the 61.8% Fibonacci level. For the moment a bearish ABC (blue) is probably taking place within wave 2 (purple), unless price breaks below the 100% Fibonacci level.
1 hour
https://fxmedia.s3.amazonaws.com/art...09-2016uj1.png
The USD/JPY momentum is strong and thus a wave 4 and 5 (brown) within wave C (blue) seems likely to take price to the 78.6% Fib, unless price breaks above resistance (red and orange).
Follow @ChrisSvorcik on twitter for latest market updates
http://www.admiralmarkets.com/analyt...e-price-action
EUR/USD
4 hour
https://fxmedia.s3.amazonaws.com/art...09-2016eu4.png
The EUR/USD bounced at the support trend line (dark green) as indicated in yesterday's wave head line, but rallied with such a bullish momentum that a larger bullish ABC (blue) is probably taking place. Price is in a wave X (purple) unless it manages to break above resistance (red) and the top Fibonacci levels.
1 hour
https://fxmedia.s3.amazonaws.com/art...09-2016eu1.png
The EUR/USD momentum is most likely a wave 3 (green) within the wave C (blue). A wave 4 (green) pullback could see support at the Fibonacci levels.
GBP/USD
4 hour
https://fxmedia.s3.amazonaws.com/art...09-2016gu4.png
The GBP/USD is an ABC zigzag correction (green/pink) that is taking place in a bullish channel. The Fibonacci levels could be targets for the C wave.
1 hour
https://fxmedia.s3.amazonaws.com/art...09-2016gu1.png
The GBP/USD also showed a bullish bounce as indicated by yesterday's headline. The subsequent momentum seems to be a wave 3 (purple) and a retracement could meet support at the Fibonacci levels of wave 4 (purple) vs 3.
USD/JPY
4 hour
https://fxmedia.s3.amazonaws.com/art...09-2016uj4.png
The USD/JPY indeed completed a head and shoulders reversal pattern (3 purple circles) after which it broke below support (dotted green). A strong bearish momentum unfolded during yesterday's trading that took price down to the 61.8% Fibonacci level. For the moment a bearish ABC (blue) is probably taking place within wave 2 (purple), unless price breaks below the 100% Fibonacci level.
1 hour
https://fxmedia.s3.amazonaws.com/art...09-2016uj1.png
The USD/JPY momentum is strong and thus a wave 4 and 5 (brown) within wave C (blue) seems likely to take price to the 78.6% Fib, unless price breaks above resistance (red and orange).
Follow @ChrisSvorcik on twitter for latest market updates