• Home
  • Forums
  • Trades
  • News
  • Calendar
  • Market
  • Brokers
  • Login
  • Join
  • User/Email: Password:
  • 12:01am
Menu
  • Forums
  • Trades
  • News
  • Calendar
  • Market
  • Brokers
  • Login
  • Join
  • 12:01am
Sister Sites
  • Metals Mine
  • Energy EXCH
  • Crypto Craft

Options

Bookmark Thread

First Page First Unread Last Page Last Post

Printable Version

Similar Threads

Paradox System: post your entry here 6 replies

Paradox system avg monthly ROR for last 12 months 31 replies

MTS Vs Random Entry - A Paradox 6 replies

lets talk about the system called PARADOX 2 replies

Newcomb’s paradox revisited? (Trading context) 2 replies

  • Trading Systems
  • /
  • Reply to Thread
  • Subscribe
  • 4,132
Attachments: The Paradox System
Exit Attachments

The Paradox System

  • Last Post
  •  
  • 1 312313Page 314315316 853
  • 1 Page 314 853
  •  
  • Post #6,261
  • Quote
  • Aug 31, 2016 1:48pm Aug 31, 2016 1:48pm
  •  fxputz
  • | Joined Aug 2016 | Status: Member | 5 Posts
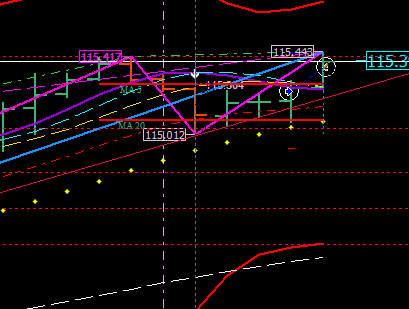
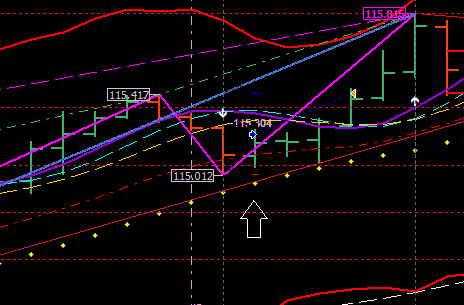
why learning Paradox, just scalping price action and using the support and resistance of the system. So, my entries will not fit your plan, nor mine for that matter. I entered at 115.212 out at 115.306 again at 115.235 and out at 115.331. Watching yours and indamoments plans and they have help me design mine. Currently, while I study this program I find these different levels from the Paradox system as extremely effective in assisting entries and exits. We find ourselves testing the resistance level again on the 1H.
  • Post #6,262
  • Quote
  • Edited Sep 1, 2016 12:24am Aug 31, 2016 9:57pm | Edited Sep 1, 2016 12:24am
  •  Elflaco
  • | Joined May 2016 | Status: Member | 132 Posts
Date: 01-09-2016 - 1.00 GMT

Daily:
ROMAR - Resistance
EMA - Support
PSAR - Support

Check List:
Last MACD 0 crossing - Up
Last EMA Alert Arrow - Up
Last DB Attachment - 115.417
Fibo up or down - Up
Notes: Market is between 4 horsemen that are up and ROMAR that is resistance. Yesterday the market almost touched ROMAR and it did touch the 50.0 Fibo
and now looks to be heading back to support.

2 HR:
OPEN PRICE - 115.250
ROMAR - Support
EMA - Support
PSAR - Support

Check List:
Last MACD 0 crossing - Down
Last EMA Alert Arrow - Up before MACD down
Last DB Attachment - DB top: 115.417 - SAR bottom: 115.012
Fibo up or down - Down
Notes: Open candle below Smooth and went down south below EMA and that is where the SAR just attached and also MACD arrow down appeared.

1 HR:
ROMAR - Support
EMA - Support
PSAR - Resistance

Check List:
Last MACD 0 crossing - Down
Last EMA Alert Arrow - Down after MACD down
Last DB Attachment - n/a
Fibo up or down - Down
Notes: Market on 1 hour is turning with PSAR flipped on current candle, MACD arrow down appeared on previous 3 candles and red EMA arrow appeared on previous 2
candles and is confirmed with current candle. EMA is at the crossing of Purple and will do so on the next candle.

Final Notes for all three charts: The market is showing a turn with the 1 hour chart and 2 hour is showing MACD arrow down and SAR bottom attachment which could
indicate an entry back into the uptrend or a retrace back against Daily support.

Entry:
Consolidation:
Long:
Short: Will enter short when red EMA appears and gets confirmed.

Notes for readjustments: 2.00 GMT - The 2.00 GMT H2 candle opened right at EMA and red EMA arrow appeared. White crossed Purple, but Smooth is still under Purple, so for me it's too early to go short, since Smooth is still support and Purple is in considerable distance from EMA. If the next H2 open candle opens below EMA and confirms red EMA arrow I will enter short. On the 1 hour EMA crossed EMA and therefore I consider the bottom SAR attachment on H2 an indication to go down and not go up into the uptrend again.

3.30 GMT - At this point the red EMA arrow disappeared, keeping EMA and PSAR support intact. Now I see I was too much focussing on H1 instead of H2. H2 EMA and Smooth were still support so going long was what I should have done. While I thought about it dove said the rule of thumb is 3 retraces before the trend ends and this was only the 2nd and also a SAR retracement to get you back into trend usually indicates ending of trend.

3.50 GMT - Eventually I did enter long at the retrace to 115.180, about 6 pips above H2 EMA support. There is a 20 pip space to Fibo 0.0, so I have a 20/20 TP/SL. The possibility is there that SAR will appear before it reaches to that level and won't make it to Fibo 0.0, so I will watch closely. While I thought about it dove said that rule of thumb is 3 retraces before a trend is to end and this was only the 2nd, also a SAR attachment to get you back into the trend at the very top or bottom usually happens at the ending of a trend.

High impact news:
7.55 GMT: EUR - German Manufacturing PMI (Aug)
14.00 GMT: USD - ISM Manufacturing PMI (Aug)
  • Post #6,263
  • Quote
  • Aug 31, 2016 10:17pm Aug 31, 2016 10:17pm
  •  InDaMoment
  • | Joined Mar 2016 | Status: Member | 131 Posts
EURJPY
Date: 2016-09-01 2000 NY time
News for USD EUR JPY: HIGH 1400 local

Daily:
ROMAR: R DN
EMA: S UP
PSAR: S UP
Last MACD 0 crossing: UP - before EMA arrow
Last EMA Alert Arrow: UP
Last DB Attachment: 115.417 T
Last SAR Attachment: 115.417 T
Fibo up or down: UP
Notes: W,S,EMA below P, SAR, DB and Magenta are attached to last bar, market is at BB and ROMAR

1HR: Open Price: 115.357
ROMAR: S UP
EMA: S UP
PSAR: S UP
Last MACD 0 crossing: DN before EMA arrow
Last EMA Alert Arrow: DN
Fibo up or down: DN
Notes: W,S crossed P at top of swing

2HR: Average Bar:
ROMAR: S UP
EMA: S UP
PSAR: S UP
Last MACD 0 crossing: DN decreasing
Last EMA Alert Arrow: UP
Last DB Attachment: 115.417 T
Last SAR Attachment: 115.012 B
Fibo up or down: DN
Notes: 4H upward, W near P, Green divergence at 115.417

Notes for all 3 charts: Consolidation, H1 and H2 are almost in sync, H1 4H are just a little ahead of H2, market may face stiff resistance at Daily ROMAR, I expect some consolidation before a solid crossing.

Entry: “No trade is better than a lost trade" In the moment, with H1 and H2 ROMARs and EMA,s in uptrend and H2 SAR attaching to bottom of a bar, I'll be looking at a long entry. H2 SAR may continue down some. Wait for swing to bottom and enter with H2 W crossing P and open at or above Smooth.
  • Post #6,264
  • Quote
  • Sep 1, 2016 2:00am Sep 1, 2016 2:00am
  •  Jens89
  • | Joined Jun 2016 | Status: Member | 85 Posts
Daily:
ROMAR - Resistance
EMA - Support
PSAR - Support

Check List:
Last MACD 0 crossing - Up
Last EMA Alert Arrow - up after macd up
Last DB Attachment - 112.303 bottom
Fibo up or down - Up
Notes: clean uptrend into ROMAR resistance. approx 40 pips away from ROMAR

2 HR:
OPEN PRICE - 115.180
ROMAR - support
EMA - support
PSAR - support

Check List:
Last MACD 0 crossing - down
Last EMA Alert Arrow - Up
Last DB Attachment - DB: 115.417
Fibo up or down - down
Notes: green divergence attached at the top, purple crossed down white. SAR attachment down

1 HR:
ROMAR - support
EMA - resistance
PSAR - resistance

Check List:
Last MACD 0 crossing - down
Last EMA Alert Arrow - down
Fibo up or down - down
Notes: horsemen going down P about to cross W

Entry:
Consolidation:
Long:when we have P/W crossing on the 1 H above smooth/ or EMA
Short: 2H has to fully turn with a PSAR flip and a red EMA arrow
  • Post #6,265
  • Quote
  • Sep 1, 2016 4:36am Sep 1, 2016 4:36am
  •  Elflaco
  • | Joined May 2016 | Status: Member | 132 Posts
Quoting Elflaco
Disliked
Date: 01-09-2016 - 1.00 GMT Daily: ROMAR - Resistance EMA - Support PSAR - Support Check List: Last MACD 0 crossing - Up Last EMA Alert Arrow - Up Last DB Attachment - 115.417 Fibo up or down - Up Notes: Market is between 4 horsemen that are up and ROMAR that is resistance. Yesterday the market almost touched ROMAR and it did touch the 50.0 Fibo and now looks to be heading back to support. 2 HR: OPEN PRICE - 115.250 ROMAR - Support EMA - Support PSAR - Support Check List: Last MACD 0 crossing - Down Last EMA Alert Arrow - Up before MACD down Last...
Ignored
Got my 20 pips, glad I saw long was the way to go at the particular time and not short.
  • Post #6,266
  • Quote
  • Sep 1, 2016 4:48am Sep 1, 2016 4:48am
  •  Jens89
  • | Joined Jun 2016 | Status: Member | 85 Posts
Quoting Elflaco
Disliked
{quote} Got my 20 pips, glad I saw long was the way to go at the particular time and not short.
Ignored
nice, I also have got my pips but less than 20.
my original plan was to get 40 which would be at the 2H bollinger band and the daily ROMAR.
but because I saw the SAR appearing, connecting with DB AND the green divergence I decided to cut it, it did retrace and I took about 10 pips.

so this is the premise I am looking out at to see where the trend will reverse:

- double SAR bounce, divergence. it could still go a bit higher or lower but it should turn. I'm not sure if it holds truth but it's what I am on the look out for now.
Attached Image
  • Post #6,267
  • Quote
  • Sep 1, 2016 4:58am Sep 1, 2016 4:58am
  •  Elflaco
  • | Joined May 2016 | Status: Member | 132 Posts
Quoting Jens89
Disliked
{quote} nice, I also have got my pips but less than 20. my original plan was to get 40 which would be at the 2H bollinger band and the daily ROMAR. but because I saw the SAR appearing, connecting with DB AND the green divergence I decided to cut it, it did retrace and I took about 10 pips. so this is the premise I am looking out at to see where the trend will reverse: - double SAR bounce, divergence. it could still go a bit higher or lower but it should turn. I'm not sure if it holds truth but it's what I am on the look out for now. {image}
Ignored
Well done! I'm also on the lookout for a reverse and when H1 starts to turn I will go on from there. As you said we have green divergence and it's the 3rd one. Together with the SAR retrace back into trend and the market being close to Daily ROMAR my thinking this uptrend is over with for the moment.
  • Post #6,268
  • Quote
  • Sep 1, 2016 8:32pm Sep 1, 2016 8:32pm
  •  InDaMoment
  • | Joined Mar 2016 | Status: Member | 131 Posts
Yesterday I took out 17 pips, would have done better but I was looking at H2 W crossing P instead of the H1 crossing. I'm ok with that since I'm still a student. ha ha
  • Post #6,269
  • Quote
  • Sep 1, 2016 11:16pm Sep 1, 2016 11:16pm
  •  InDaMoment
  • | Joined Mar 2016 | Status: Member | 131 Posts
EURJPY
Date: 2016-09-02 2000 NY time
News for USD EUR JPY: HIGH 1400 local

Daily:
ROMAR: R DN
EMA: S UP
PSAR: S UP
Last MACD 0 crossing: UP - before EMA arrow
Last EMA Alert Arrow: UP
Last DB Attachment: 115.816 T
Last SAR Attachment: 115.816 T
Fibo up or down: UP
Notes: W,S,EMA below P, SAR, DB and Magenta are attached to last bar, market is at BB and ROMAR - 115.534, Open is above ROMAR

1HR: Open Price: 115.530
ROMAR: S UP
EMA: S UP
PSAR: R DN
Last MACD 0 crossing: DN
Last EMA Alert Arrow: UP
Fibo up or down: DN
Notes: W,P, EMA are tight

2HR: Average Bar:
ROMAR: S UP
EMA: S UP
PSAR: S UP
Last MACD 0 crossing: DN increasing
Last EMA Alert Arrow: UP
Last DB Attachment: 115.816 T
Last SAR Attachment: 115.816 T
Fibo up or down: DN
Notes: W crossed P at top of mini swing

Notes for all 3 charts: Consolidation, H1 and H2 are not in sync, Daily ROMAR is significant resistance

Entry: “No trade is better than a lost trade" In the moment, H1 and H2 ROMARs are support and Daily ROMAR is resistance. Also H1 and H2 4H are out of sync. With H1 PSAR flipping to support, I'll enter long on small retrace, but only for 20 pips because of Daily ROMAR.
  • Post #6,270
  • Quote
  • Edited at 1:55am Sep 2, 2016 1:45am | Edited at 1:55am
  •  Elflaco
  • | Joined May 2016 | Status: Member | 132 Posts
Quoting InDaMoment
Disliked
Yesterday I took out 17 pips, would have done better but I was looking at H2 W crossing P instead of the H1 crossing. I'm ok with that since I'm still a student. ha ha
Ignored
At least it was a winning trade . My mistake yesterday was that I first interpreted the bottom SAR attachment as a sign of a new trend downwards with the red EMA arrow (which wasn't confirmed at that stage and disappeared when market got above EMA again). I was anticipating instead of trading in the moment with 1 hour turning in the downtrend, but the next open 2 hour candle was right at EMA support and it had the 23.6 Fibo also as support and White was only sliding on top of Purple. That would have been 32 pips to the Fibo 0.0 line instead of the 20 pips I got now. In hindsight it would have made it to 40 pips easily.

In a couple of hours we have the NFP announcement and usually, at least as I've seen the last couple of times, the hours before the announcement market is indecisive and goes sideways. Therefore I will just watch the market today and not trade it. Especially with indicators showing long while we're at the top of H1/H2 market and above Daily ROMAR resistance.
Attached Image
  • Post #6,271
  • Quote
  • Sep 2, 2016 2:51am Sep 2, 2016 2:51am
  •  InDaMoment
  • | Joined Mar 2016 | Status: Member | 131 Posts
Quoting Elflaco
Disliked
{quote} At least it was a winning trade . My mistake yesterday was that I first interpreted the bottom SAR attachment as a sign of a new trend downwards with the red EMA arrow (which wasn't confirmed at that stage and disappeared when market got above EMA again). I was anticipating instead of trading in the moment with 1 hour turning in the downtrend, but the next open 2 hour candle was right at EMA support and it had the 23.6 Fibo also as support and White was only sliding on top of Purple. That would have been 32 pips to the Fibo 0.0...
Ignored
I followed my plan today, even though I knew it didn't have as much confluence as I would like. It just closed for 18.1 pips. Now I'm out until after NFP. I had a reasonably good week - I hope you all did too!
  • Post #6,272
  • Quote
  • Sep 2, 2016 2:56am Sep 2, 2016 2:56am
  •  Jens89
  • | Joined Jun 2016 | Status: Member | 85 Posts
Quoting InDaMoment
Disliked
{quote} I followed my plan today, even though I knew it didn't have as much confluence as I would like. It just closed for 18.1 pips. Now I'm out until after NFP. I had a reasonably good week - I hope you all did too!
Ignored
very nice!

at the moment I find it hardest to struggle sometimes that when we get a retracement to smooth / EMA or whatever, I think is this a retracement or the start of a reversal?

it's like you took that long there the other day:

Attached Image


what is the big difference in that screenshot in comparison to the other situations where it retraced and continued up

past days we've only gone up with little retracements. Today I haven't made a plan as I do not really plan to trade with NFP. I also did not expect price to go up much higher than ROMAR.
  • Post #6,273
  • Quote
  • Sep 2, 2016 3:17am Sep 2, 2016 3:17am
  •  Elflaco
  • | Joined May 2016 | Status: Member | 132 Posts
Quoting InDaMoment
Disliked
{quote} I followed my plan today, even though I knew it didn't have as much confluence as I would like. It just closed for 18.1 pips. Now I'm out until after NFP. I had a reasonably good week - I hope you all did too!
Ignored
In hindsight it was a nice entry on the open of this 6.00 GMT 2 hour candle. I remember that dove said that lower/low or higher/high was consistence with a slider on the Fibo. That's again what happened just now and what has been happening the last couple of days when we were in the top of the chart a lot of times.
  • Post #6,274
  • Quote
  • Sep 2, 2016 3:25am Sep 2, 2016 3:25am
  •  InDaMoment
  • | Joined Mar 2016 | Status: Member | 131 Posts
Quoting Jens89
Disliked
{quote} very nice! at the moment I find it hardest to struggle sometimes that when we get a retracement to smooth / EMA or whatever, I think is this a retracement or the start of a reversal? it's like you took that long there the other day: {image} what is the big difference in that screenshot in comparison to the other situations where it retraced and continued up past days we've only gone up with little retracements. Today I haven't made a plan as I do not really plan to trade with NFP. I also did not expect price to go up much higher than ROMAR....
Ignored
I have the same problem as you and Elflaco has mentioned it too. I think we need as much confluence as possible and I also look at the distance between Purple, White and Smooth. I also consider the steepness of the crossings. If it's more shallow it is more likely to continue in trend.

We're all learning and I believe that this is a great system and we will all improve with experience. Some things cannot be explained easily, but smooth out with experience. Jens89, Elflaco, me and others will succeed because we are here with enthusiasm and improving consistently.
  • Post #6,275
  • Quote
  • Sep 2, 2016 3:49am Sep 2, 2016 3:49am
  •  Elflaco
  • | Joined May 2016 | Status: Member | 132 Posts
Quoting InDaMoment
Disliked
{quote} I have the same problem as you and Elflaco has mentioned it too. I think we need as much confluence as possible and I also look at the distance between Purple, White and Smooth. I also consider the steepness of the crossings. If it's more shallow it is more likely to continue in trend. We're all learning and I believe that this is a great system and we will all improve with experience. Some things cannot be explained easily, but smooth out with experience. Jens89, Elflaco, me and others will succeed because we are here with enthusiasm and...
Ignored
Yes I like your winning attitude my friend! I totally feel the same way and there is no doubt in my mind that we're gonna rock this system and become 80+% profitable. My biggest problem to overcome is anticipating and biasness. I'm watching for a short for quite a while because of Daily ROMAR resistance, and by that I miss the nice long entries on the H2 slider with H1 giving some new momentum with swings. I have to keep working on that.
  • Post #6,276
  • Quote
  • Sep 2, 2016 3:50am Sep 2, 2016 3:50am
  •  InDaMoment
  • | Joined Mar 2016 | Status: Member | 131 Posts
Quoting Elflaco
Disliked
{quote} In hindsight it was a nice entry on the open of this 6.00 GMT 2 hour candle. I remember that dove said that lower/low or higher/high was consistence with a slider on the Fibo. That's again what happened just now and what has been happening the last couple of days when we were in the top of the chart a lot of times.
Ignored
Yes, Also, notice that the green divergence is on it's fourth attachment. And, before I made that entry, I considered that Daily ROMAR was breached yesterday so it isn't a brick wall. Maybe the Daily trend is in the process of changing.

Maybe Daily ROMAR will be support in a few days.
  • Post #6,277
  • Quote
  • Sep 2, 2016 3:53am Sep 2, 2016 3:53am
  •  Elflaco
  • | Joined May 2016 | Status: Member | 132 Posts
Quoting InDaMoment
Disliked
{quote} Yes, Also, notice that the green divergence is on it's fourth attachment. And, before I made that entry, I considered that Daily ROMAR was breached yesterday so it isn't a brick wall. Maybe the Daily trend is in the process of changing. Maybe Daily ROMAR will be support in a few days.
Ignored
Yes you're right, I missed those signals by being biased for a short. Have to keep an open mind!
  • Post #6,278
  • Quote
  • Sep 2, 2016 3:56am Sep 2, 2016 3:56am
  •  Jens89
  • | Joined Jun 2016 | Status: Member | 85 Posts
Quoting InDaMoment
Disliked
{quote} Yes, Also, notice that the green divergence is on it's fourth attachment. And, before I made that entry, I considered that Daily ROMAR was breached yesterday so it isn't a brick wall. Maybe the Daily trend is in the process of changing. Maybe Daily ROMAR will be support in a few days.
Ignored
I'd be careful in saying that it has been breached. price is over it but purple hasn't crossed so you cannot say it has been breached. though, I also looked at it as a big stop but if you look at all the other factors: 1H and 2H ROMAR, 4 horsemen EMA all in an uptrend and on the daily all the horsemen and EMA are also in an uptrend. we cannot say yet that the daily will eventually breached, there could easily be a slider of EMA eventually but this would just be anticipating. in the moment we can only say that we are in a strong shorter term uptrend. but I also like your enthusiasm indamoment. even if you don't understand the full system you can still find a couple of situations where you are very confident about and only wait for those specific situations. the system is complex but if you understand it to the full extend you will have an accuracy that you cannot achieve in any other system.
  • Post #6,279
  • Quote
  • Sep 2, 2016 4:28am Sep 2, 2016 4:28am
  •  Jens89
  • | Joined Jun 2016 | Status: Member | 85 Posts
Quoting Jens89
Disliked
{quote} I'd be careful in saying that it has been breached. price is over it but purple hasn't crossed so you cannot say it has been breached. though, I also looked at it as a big stop but if you look at all the other factors: 1H and 2H ROMAR, 4 horsemen EMA all in an uptrend and on the daily all the horsemen and EMA are also in an uptrend. we cannot say yet that the daily will eventually breached, there could easily be a slider of EMA eventually but this would just be anticipating. in the moment we can only say that we are in a strong shorter term...
Ignored
by the way by "you" I didn't mean you specifically I just meant as one in general
  • Post #6,280
  • Quote
  • Sep 2, 2016 8:04pm Sep 2, 2016 8:04pm
  •  dove_alliance
  • Joined Jun 2007 | Status: Trading Live For The Last 14 Years. | 5,761 Posts
Hello traders and blessing -

I am not here to train but to post some advice; and one of the greatest advice an experience trader gives is you never, ever trade against the trend. It matters not if the market is ranging or consolidating - there is always a trend.

The Paradox was given to you with rules that are set in stone; and if you break the rules - you will lose. If you create your own rules - you will lose. If you try to interpret or shift the rules for your own benefit, and/or what you think will happen - you will lose.

I have stated it very clearly throughout my tutorials that the 1 hour chart (H1) IS NOT A TRADING CHART but ONLY a reference chart for the 2 hour (H2) chart which is your trading and trend chart. The 1 hour is only a reference for syncs WITH the 2 hour chart. And by trading the 1 hour chart takes you into the perfect storm of becoming a loser.

There are only two venues of being a trader:

1 - being objective.

Or:

2 - being subjective.

Being objective is also being steadfast with faith, believing, and controlling your own emotions.

Being subjective is also being intimidated with the market having control.

Being objective means you never, ever chase the market but let the market come to you.

Which chart controls the trend? The answer is the H2 chart.

What is trend with the H2 chart? The answer is ROMAR as primary and it changes trend when it crosses EMA. Above EMA is in a downtrend - below EMA is in an uptrend. Your secondary trend are the Parabolics. And the Parabolics is in control of the 4 horsemen. This means if the Parabolic does not flip then you are in a slider going back into the original trend.

The only way the market can change direction (either reversal or swing) is with the FLIP OF THE PARABOLIC. And that is with EMA at or crossing Purple. If you are trading against the parabolic trend then you are also losing your trades. Which also means you are breaking the rules of trading.

The Paradox is telling you a story from bar to bar and I havent seen anyone listening to what the Paradox is saying.

The greatest mistake a trader can make is predicting or thinking what the market will do. The Paradox is 100% correct but your thinking is not. You would be lucky to be 30% correct with your thinking.

I also see a lot of trading plans correct in matching the H1 in sync with the H2. But those plans are very seldom ever traded. That means too much fear in believing what you are seeing not being true. This traders is what I would call shameful in not following through with your own plans. Because someone says something that does not match up with your plans does not mean that person is right. On the contrary - you are right. Your trading plan is your greatest tool in getting you into the right trade (provided your plan is with the trend). And getting into the right trade is when the H1 is in sync with the H2.

Below is a screen shot of my entry Tuesday on the H2 chart. It is showing two entries and I took the second entry with the Parabolic. And why would I wait on the second entry. The reason was because of the Daily Uptrend. I was waiting on the market to make its way to me with the Parabolic. The market is up with the Daily and it was going nowhere but up once the H2 Parabolic had flipped. It was then in sync with the Daily.

With this entry I rode the trend. When the SAR retraced on the H2 I took a second entry and rode both entries to the top. Because of the rule of first in and first out I took 210 pips with the first entry and then 131 with the second entry.

The rules are set in stone for a reason. Continue in breaking the rules and you will continue to be a loser.

Everything is there for you in all of my tutorials - nothing has been left out. All you need to do is learn the rules for trading.

Attached Image (click to enlarge)
Click to Enlarge

Name: EURJPYproH2_09-01.PNG
Size: 12 KB
The Dove - Forex Trainer
5
  • Trading Systems
  • /
  • The Paradox System
  • Reply to Thread
    • 1 312313Page 314315316 853
    • 1 Page 314 853
1 trader viewing now
  • More
Top of Page
  • Facebook
  • Twitter
About FF
  • Mission
  • Products
  • User Guide
  • Media Kit
  • Blog
  • Contact
FF Products
  • Forums
  • Trades
  • Calendar
  • News
  • Market
  • Brokers
  • Trade Explorer
FF Website
  • Homepage
  • Search
  • Members
  • Report a Bug
Follow FF
  • Facebook
  • Twitter

FF Sister Sites:

  • Metals Mine
  • Energy EXCH
  • Crypto Craft

Forex Factory® is a brand of Fair Economy, Inc.

Terms of Service / ©2021