• Home
  • Forums
  • Trades
  • News
  • Calendar
  • Market
  • Brokers
  • Login
  • Join
  • User/Email: Password:
  • 11:21pm
Menu
  • Forums
  • Trades
  • News
  • Calendar
  • Market
  • Brokers
  • Login
  • Join
  • 11:21pm
Sister Sites
  • Metals Mine
  • Energy EXCH
  • Crypto Craft

Options

Bookmark Thread

First Page First Unread Last Page Last Post

Printable Version

Similar Threads

Paradox System: post your entry here 6 replies

Paradox system avg monthly ROR for last 12 months 31 replies

MTS Vs Random Entry - A Paradox 6 replies

lets talk about the system called PARADOX 2 replies

Newcomb’s paradox revisited? (Trading context) 2 replies

  • Trading Systems
  • /
  • Reply to Thread
  • Subscribe
  • 4,132
Attachments: The Paradox System
Exit Attachments

The Paradox System

  • Last Post
  •  
  • 1 308309Page 310311312 853
  • 1 Page 310 853
  •  
  • Post #6,181
  • Quote
  • Aug 23, 2016 5:17pm Aug 23, 2016 5:17pm
  •  wiseguytrade
  • | Joined Sep 2014 | Status: Member | 63 Posts
Hi Elflaco,

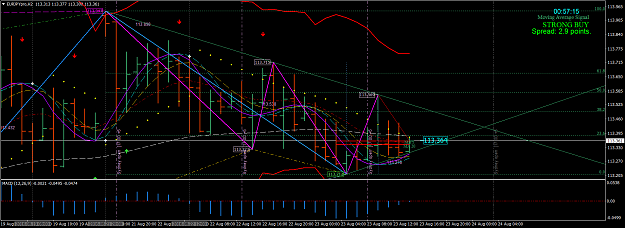
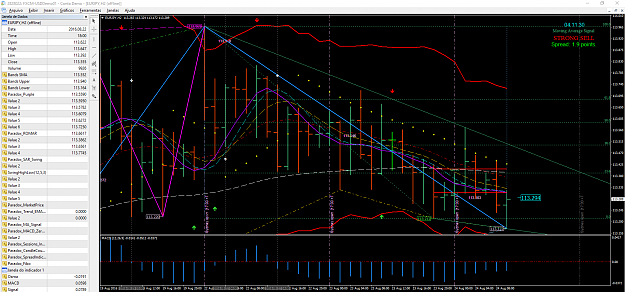
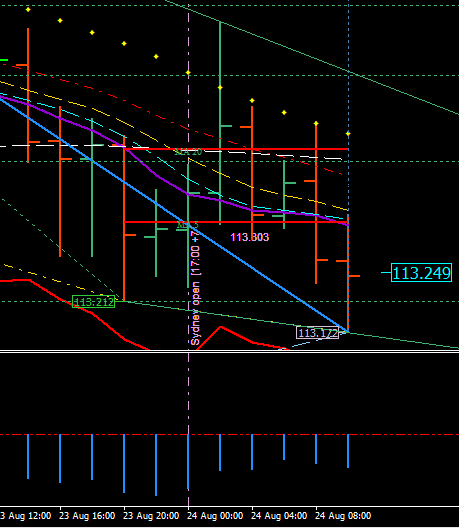
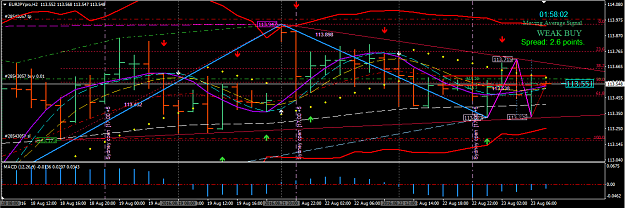
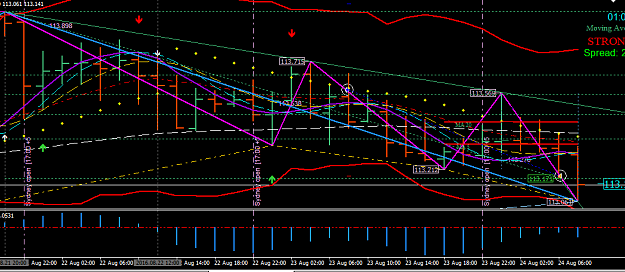
I am new to Paradox, only a few days old, but not new to trading, over 30 years. In answer to your question, I went short and still am short from about 14:08 GMT because I waited for price to retrace to the down sloping Four Horsemen and below ROMAR on both the 1 and 2 Hr. Since I knew that the 4HM would be resistance and the market hadn't fallen big time yet, it was the time to jump on in.

Hope that helps. I enjoy your postings.

WGT
  • Post #6,182
  • Quote
  • Aug 23, 2016 8:10pm Aug 23, 2016 8:10pm
  •  InDaMoment
  • | Joined Mar 2016 | Status: Member | 131 Posts
EURJPY
Date: 2016-08-24 2000 NY time
News for USD EUR JPY: 1300 local

Daily:
ROMAR: R DN
EMA: S UP
PSAR: S UP
Last MACD 0 crossing: UP - before EMA arrow
Last EMA Alert Arrow: DN
Last DB Attachment: 112.303 B
Last SAR Attachment: 112.303 B
Fibo up or down: DN
Notes: W,S below P, EMA crossed P

1HR: Open Price: 113.282
ROMAR: R DN
EMA: R DN
PSAR: R DN
Last MACD 0 crossing: UP
Last EMA Alert Arrow: UP
Fibo up or down: UP
Notes: W,S crossed P at bottom

2HR: Average Bar:
ROMAR: R DN
EMA: R DN
PSAR: R DN
Last MACD 0 crossing: DN decreasing
Last EMA Alert Arrow: DN
Last DB Attachment: 113.212 B
Last SAR Attachment: 113.212 B
Fibo up or down: UP
Notes: W,S crossed P

Notes for all 3 charts: Consolidation, H2 W crossed P and H1 W,S crossed P so now H1 and H2 are in sync

Entry: “No trade is better than a lost trade” Will enter long on retrace to resistance
  • Post #6,183
  • Quote
  • Aug 23, 2016 8:11pm Aug 23, 2016 8:11pm
  •  InDaMoment
  • | Joined Mar 2016 | Status: Member | 131 Posts
I forgot to mention on my trade plan that we have gold divergence
  • Post #6,184
  • Quote
  • Aug 23, 2016 9:10pm Aug 23, 2016 9:10pm
  •  InDaMoment
  • | Joined Mar 2016 | Status: Member | 131 Posts
Quoting Elflaco
Disliked
{quote} I took a trade today, which was not according to my plan. I entered long at 8.00 GMT H2 open candle. I got the Limegreen arrow on the H2 as well as the H1, but both were not set in stone, as they just appeared on the open candles. I was anticipating since the H2 open candle was above EMA with White and Smooth under Purple in a slider and Purple close to EMA. Ofcourse my plan asked for the Limegreen arrows, but they needed to be set in stone. That was my intention when creating the plan, but when I saw the arrows I took the trade in a whim,...
Ignored
Well, we've all been there. Just pick up the pieces and move on.

By the way, I think you're doing a great job of putting some life back into this thread.
  • Post #6,185
  • Quote
  • Aug 24, 2016 1:19am Aug 24, 2016 1:19am
  •  Elflaco
  • | Joined May 2016 | Status: Member | 132 Posts
Date: 24-08-2016 - 4.00 GMT

Daily:
ROMAR - Resistance
EMA - Support
PSAR - Support

Check List:
Last MACD 0 crossing - Up
Last EMA Alert Arrow - Down after MACD up
Last DB Attachment - 112.303 down
Fibo up or down - Down
Notes: Daily is in a tight slider with Purple over White, EMA and Smooth. Open candle was at Smooth.

2 HR:
OPEN PRICE - 133.333
ROMAR - Resistance
EMA - Resistance
PSAR - Resistance

Check List:
Last MACD 0 crossing - Down
Last EMA Alert Arrow - Down after MACD crossing with Limegreen arrow in between
Last DB Attachment - DB bottom: 113.212 - SAR up: 113.569
Fibo up or down - Up
Notes: White just crossed Purple for ending of the downswing and Smooth is at Purple. Open candle below EMA with EMA close enough to Parabolic for a possible flip. EMA is also close below ROMAR, so it could very well cross it. The upper SAR attachment could indicate that we search for a newer low, since we are making LH's and LL's.

1 HR:
ROMAR - Resistance
EMA - Support
PSAR - Support

Check List:
Last MACD 0 crossing - Up
Last EMA Alert Arrow - Up after MACD up - Limegreen arrow not confirmed yet
Last DB Attachment - n/a
Fibo up or down - Up
Notes: 4 horsemen in uptrend with open candle below Smooth. Purple and White are sliding.

Final Notes for all three charts: We are in a ROMAR downtrend, but the Fibo's are not in sync with H1/H2 green Fibo and Daily red Fibo. We have little movement in the market in the last 5 days, and even the weeks before that, so I'm aiming for 20 pips instead of 40 pips today. We are close at the bottom in H1 and H2 with ROMAR holding resistance just above the market in both charts.

Entry:
Consolidation:
Long: Will enter long of support when H2 EMA crosses its ROMAR with H1 4 horsemen in alignment for an uptrend.
Short: A short at this time close to H1/H2 bottom and with Daily EMA and Smooth holding resistance is too risky for me.

Notes for readjustments:

News:
6.00 GMT - EUR: German GDP - high impact
  • Post #6,186
  • Quote
  • Aug 24, 2016 1:24am Aug 24, 2016 1:24am
  •  Elflaco
  • | Joined May 2016 | Status: Member | 132 Posts
Quoting InDaMoment
Disliked
Will enter long on retrace to resistance
Ignored
You meant short right? As it already retraced into resistance, did you pull the trigger?
  • Post #6,187
  • Quote
  • Aug 24, 2016 1:40am Aug 24, 2016 1:40am
  •  mahmood.tava
  • | Joined Jul 2016 | Status: Member | 54 Posts
Quoting Elflaco
Disliked
{quote} I took a trade today, which was not according to my plan. I entered long at 8.00 GMT H2 open candle. I got the Limegreen arrow on the H2 as well as the H1, but both were not set in stone, as they just appeared on the open candles. I was anticipating since the H2 open candle was above EMA with White and Smooth under Purple in a slider and Purple close to EMA. Ofcourse my plan asked for the Limegreen arrows, but they needed to be set in stone. That was my intention when creating the plan, but when I saw the arrows I took the trade in a whim,...
Ignored
hi mate
according to your plan yesterday i did not enter any trade
i saw no signal
but i am always comfused with paradox
realy i do not know what to do step by step
i know about 4 hourseman romar ema psar sar and .....
but realy i do not know what to do step by step

if u or every body here can help please help me
  • Post #6,188
  • Quote
  • Aug 24, 2016 1:50am Aug 24, 2016 1:50am
  •  InDaMoment
  • | Joined Mar 2016 | Status: Member | 131 Posts
Quoting Elflaco
Disliked
{quote} You meant short right? As it already retraced into resistance, did you pull the trigger?
Ignored
I went long after 2200 NY time at 113.399. I know ROMAR is resistance but maybe it's weak because EMA is near. I went in at 40/40, but You're probably right , so I'll probably lower my tp to 20.
  • Post #6,189
  • Quote
  • Aug 24, 2016 1:55am Aug 24, 2016 1:55am
  •  mahmood.tava
  • | Joined Jul 2016 | Status: Member | 54 Posts
Quoting InDaMoment
Disliked
EURJPY Date: 2016-08-24 2000 NY time News for USD EUR JPY: 1300 local Daily: ROMAR: R DN EMA: S UP PSAR: S UP Last MACD 0 crossing: UP - before EMA arrow Last EMA Alert Arrow: DN Last DB Attachment: 112.303 B Last SAR Attachment: 112.303 B Fibo up or down: DN Notes: W,S below P, EMA crossed P 1HR: Open Price: 113.282 ROMAR: R DN EMA: R DN PSAR: R DN Last MACD 0 crossing: UP Last EMA Alert Arrow: UP Fibo up or down: UP Notes: W,S crossed P at bottom 2HR: Average Bar: ROMAR: R DN EMA: R DN PSAR: R DN Last MACD 0 crossing: DN decreasing Last EMA Alert...
Ignored
hi
i double check your plan is good
tanx dood
  • Post #6,190
  • Quote
  • Aug 24, 2016 1:57am Aug 24, 2016 1:57am
  •  mahmood.tava
  • | Joined Jul 2016 | Status: Member | 54 Posts
Quoting Elflaco
Disliked
Date: 24-08-2016 - 4.00 GMT Daily: ROMAR - Resistance EMA - Support PSAR - Support Check List: Last MACD 0 crossing - Up Last EMA Alert Arrow - Down after MACD up Last DB Attachment - 112.303 down Fibo up or down - Down Notes: Daily is in a tight slider with Purple over White, EMA and Smooth. Open candle was at Smooth. 2 HR: OPEN PRICE - 133.333 ROMAR - Resistance EMA - Resistance PSAR - Resistance Check List: Last MACD 0 crossing - Down Last EMA Alert Arrow - Down after MACD crossing with Limegreen arrow in between Last DB Attachment - DB bottom:...
Ignored
hi dood
same as inDAmoment double check your plan
every thing is good
  • Post #6,191
  • Quote
  • Aug 24, 2016 1:58am Aug 24, 2016 1:58am
  •  Elflaco
  • | Joined May 2016 | Status: Member | 132 Posts
Quoting mahmood.tava
Disliked
{quote} hi mate according to your plan yesterday i did not enter any trade i saw no signal but i am always comfused with paradox realy i do not know what to do step by step i know about 4 hourseman romar ema psar sar and ..... but realy i do not know what to do step by step if u or every body here can help please help me
Ignored
You should not make a trading decision based on somebody else's plan. I might see things a lot more different than you and besides that the meaning of this thread is to learn to trade this system by yourself. The first step is read the thread carefully so you know what you might look for in creating a trading plan, then create a trading plan on a daily basis and learn from that. If you look for a trade based on my plan you do not train your eyes in seeing what the indicators tell you.
  • Post #6,192
  • Quote
  • Aug 24, 2016 2:03am Aug 24, 2016 2:03am
  •  Elflaco
  • | Joined May 2016 | Status: Member | 132 Posts
Quoting InDaMoment
Disliked
{quote} I went long after 2200 NY time at 113.399. I know ROMAR is resistance but maybe it's weak because EMA is near. I went in at 40/40, but You're probably right , so I'll probably lower my tp to 20.
Ignored
Well, I wouldn't say weak as it is the strongest indicator in the system after that comes H2 EMA, which is also still resistance, so at this point I think it's a risky trade.
  • Post #6,193
  • Quote
  • Aug 24, 2016 2:06am Aug 24, 2016 2:06am
  •  mahmood.tava
  • | Joined Jul 2016 | Status: Member | 54 Posts
According to H2 chart now

white / purple crosed means Psar eliminated
both fibo in H1 and H2 is green

i think if we have an open next H2 candle above Psar we can enter long

am i true?
Attached Image (click to enlarge)
Click to Enlarge

Name: 5555.png
Size: 83 KB
  • Post #6,194
  • Quote
  • Aug 24, 2016 2:14am Aug 24, 2016 2:14am
  •  InDaMoment
  • | Joined Mar 2016 | Status: Member | 131 Posts
Quoting Elflaco
Disliked
{quote} Well, I wouldn't say weak as it is the strongest indicator in the system after that comes H2 EMA, which is also still resistance, so at this point I think it's a risky trade.
Ignored
You are definitely right, it looks risky. I thought it looked good when I opened, but now I'm thinking that I may close it if I see the right opportunity.
  • Post #6,195
  • Quote
  • Edited at 4:07am Aug 24, 2016 3:44am | Edited at 4:07am
  •  Elflaco
  • | Joined May 2016 | Status: Member | 132 Posts
Quoting mahmood.tava
Disliked
According to H2 chart now white / purple crosed means Psar eliminated both fibo in H1 and H2 is green i think if we have an open next H2 candle above Psar we can enter long am i true? {image}
Ignored
Your answer is in my previous post.
  • Post #6,196
  • Quote
  • Edited at 4:03am Aug 24, 2016 3:49am | Edited at 4:03am
  •  manin011
  • | Joined Aug 2016 | Status: novato | 100 Posts
Quoting mahmood.tava
Disliked
According to H2 chart now white / purple crosed means Psar eliminated both fibo in H1 and H2 is green i think if we have an open next H2 candle above Psar we can enter long am i true? {image}
Ignored
Hello. I am studying the paradox there is a month. I found that my graph H2 is very different so yours. The account is with FXCM
Attached Image (click to enlarge)
Click to Enlarge

Name: Screenshot4.png
Size: 151 KB
Attached Image
  • Post #6,197
  • Quote
  • Aug 24, 2016 4:53am Aug 24, 2016 4:53am
  •  Jens89
  • | Joined Jun 2016 | Status: Member | 85 Posts
Hi people,

I'd like to share a trade with you I've done yesterday and made a similar mistake as elflaco. And I fully admit it was a mistake which could have been prevented in case I made a trading plan. At the moment I'm on holidays and still want to trade. yesterday morning I had a bit of time and just looked at the market and did not make a plan.

first of all on the 2 hour I saw a double attachment down of the SAR and a cross of purple above smooth and white. We also have EMA above ROMAR. HOWEVER, we EMA is still resistance and the PSARs are still resistance. I talked myself because of the SAR making the move, the divergence attaching and the other factors that we'd be good to go long. I'd say it's a mixture of wanting to do a trade, not having a plan, having limited time that made execute. and as dove says, the rules are set in stone, if you break the rules, you'll only burn yourself which is exactly what happened.

Attached Image (click to enlarge)
Click to Enlarge

Name: Screenshot1.png
Size: 268 KB


I purposely posted the screenshot of the moment of entry first and below I'll post you the full trade. And this, is why it's really recommended to take screenshots of every trade you do in the moment in which you see the indicators do their job. when you keep logs of every trade you will be able to verify your mistakes back in time and that is absolutely crucial in learning as well. when looking afterwards you can see what a bad trade it was

Attached Image (click to enlarge)
Click to Enlarge

Name: Screenshot2.png
Size: 62 KB


if not only for not being able to see things as they are and stay unbiased when making your trading plan. sticking to the plan you made beforehand and only sticking to it, will keep your objectivity and stop you from talking yourself into trades
  • Post #6,198
  • Quote
  • Edited at 6:17am Aug 24, 2016 5:20am | Edited at 6:17am
  •  Elflaco
  • | Joined May 2016 | Status: Member | 132 Posts
Quoting Jens89
Disliked
Hi people, I'd like to share a trade with you I've done yesterday and made a similar mistake as elflaco. And I fully admit it was a mistake which could have been prevented in case I made a trading plan. At the moment I'm on holidays and still want to trade. yesterday morning I had a bit of time and just looked at the market and did not make a plan. first of all on the 2 hour I saw a double attachment down of the SAR and a cross of purple above smooth and white. We also have EMA above ROMAR. HOWEVER, we EMA is still resistance and the PSARs are still...
Ignored
Thanks for sharing your trade. We entered at the exact same candle for different reasons, as I entered a little later with the Limegreen arrow showing. We ignored two of three major support/resistance levels: EMA and Parabolic. It's good, because this again indicates the tremendous value that they have when creating a trading plan.

When I created my trading plan this morning I was biased for a long, because I saw support on Daily with EMA and Smooth. On the other hand H2 had ROMAR, EMA and Parabolic in resistance with market being close to the bottom. On my trading plan I had the upper SAR attachment for a possible lower/low, but I wasn't looking for an entry short from resistance. It's not easy putting all the pieces together and keep improving my trading plans and pay attention what ROMAR, EMA and Parabolic are telling me. Maybe I should've not given so much value to Daily support of EMA and Smooth as they are in a tight slider..

The 8.00 GMT candle, which is now still running, was a good entry going short with entry off Smooth in a slider and below H1 4 horsemen that were aligned for downtrend. I did see it, but the bottom was only 10 pips away and thus I didn't know where my exit should be. So how can we determine the exit in such a trade to Fibo 0.0?
  • Post #6,199
  • Quote
  • Aug 24, 2016 6:38am Aug 24, 2016 6:38am
  •  Elflaco
  • | Joined May 2016 | Status: Member | 132 Posts
Quoting manin011
Disliked
{quote} Hello. I am studying the paradox there is a month. I found that my graph H2 is very different so yours. The account is with FXCM {image} {image}
Ignored
Read posts 6150 and 6155 and you will be able to get the charts right.
  • Post #6,200
  • Quote
  • Aug 24, 2016 11:17am Aug 24, 2016 11:17am
  •  mahmood.tava
  • | Joined Jul 2016 | Status: Member | 54 Posts
Quoting manin011
Disliked
{quote} Hello. I am studying the paradox there is a month. I found that my graph H2 is very different so yours. The account is with FXCM {image} {image}
Ignored
hi mate
your problem is your broker
open an account in forex.com broker
seems this system only work with that broker data
  • Trading Systems
  • /
  • The Paradox System
  • Reply to Thread
    • 1 308309Page 310311312 853
    • 1 Page 310 853
1 trader viewing now
  • More
Top of Page
  • Facebook
  • Twitter
About FF
  • Mission
  • Products
  • User Guide
  • Media Kit
  • Blog
  • Contact
FF Products
  • Forums
  • Trades
  • Calendar
  • News
  • Market
  • Brokers
  • Trade Explorer
FF Website
  • Homepage
  • Search
  • Members
  • Report a Bug
Follow FF
  • Facebook
  • Twitter

FF Sister Sites:

  • Metals Mine
  • Energy EXCH
  • Crypto Craft

Forex Factory® is a brand of Fair Economy, Inc.

Terms of Service / ©2021