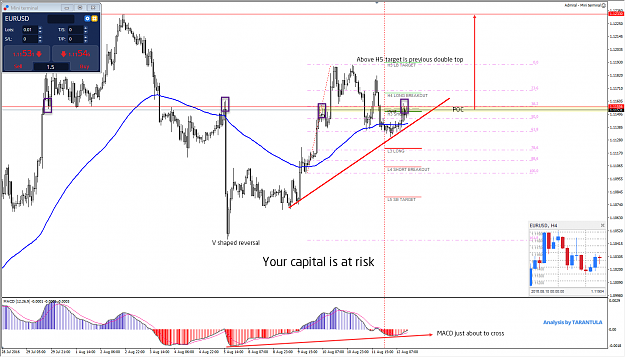
EUR/USD
4 hour https://fxmedia.s3.amazonaws.com/art...08-2016eu4.png
The EUR/USD bounced at the deep Fibonacci retracement level of 78.6% within a wave 2 (purple). A break above the 100% level invalidates wave 2 (purple) and indicates a large and complex correction. In that case the wave count will be changed to reflect the corrective zone. A break below support could still confirm the potential waves 3 (purple/brown) but sufficient momentum must be visible in the breakouts.
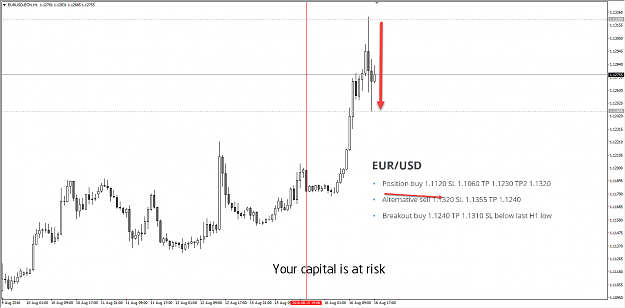
1 hour https://fxmedia.s3.amazonaws.com/art...08-2016eu1.png
The EUR/USD has clear resistance (red/Fib) and support levels above and below price. A bearish break could start the impulsive waves (purple/blue) whereas a bullish breakout would indicate an ABC correction (purple).
Hi Traders, next week we have a great webinar schedule with Nenad's setups on Monday, Keltner trading on Tuesday (Forex market trading) and Wednesday (strategy) and Heiken Ashi trading system on Thursday. Hope to see you then! http://www.admiralmarkets.com/education/webinars/ - Your capital is at risk
Hello,Tarantula.Can you expalin in short terms, what means that pivt indicators.For example,If price come to any of this level,it is a big possible that the price do that,if you understand me.My friend want to work with this system,he has a indicator(pivot),but he doesn"t speak English.I am too tired with all this study ,because I have not lucky in a begining and I study too much garbage.I have a feeling that this is a good stuff(official Admiral markets stuff),but really,I don"t have an Energy.Till to now,I am study much,much more,than all my University study.
EUR/USD
4 hour https://fxmedia.s3.amazonaws.com/art...08-2016eu4.png
The EUR/USD is testing the resistance trend line (red). A breakout above resistance could see price move towards the wave E (green) of wave 4 (blue), which has been added due to the lack of a bearish breakout. The consolidation zone on the daily chart is lengthy and suggests a contracting triangle chart pattern (ABCDE brown).
1 hour https://fxmedia.s3.amazonaws.com/art...08-2016eu1.png
The EUR/USD showed bullish momentum above the broken trend line (dotted red). Price is building an ABC bullish zigzag (blue) unless price breaks below the 100% Fibonacci level of wave B.
https://lh4.googleusercontent.com/bj...cL0zFHph5Xkejs
Dear Traders,
Most market players recognise the importance of risk management.
However, this doesn't prevent us from failing to correctly implement a trading risk plan.
Did you ever wonder why controlling the risk in trading can be so challenging?
This article will teach you how to defend yourself against riskless behaviour and fearful trading.
Moreover, I will show you how your trading behaviour makes you vulnerable.
The reality is that people behave differently, depending on whether they experience loss or profit:
...a trader who keeps losing will risk more…
...and a trader who keeps winning will risk less.
Our emotional reaction to winning and losing decides whether we go for a more conservative or aggressive approach in trading.
The problem with fluctuating risk perception
The biggest problem is that.... http://www.admiralmarkets.com/analyt...e-your-trading
EUR/USD
4 hour https://fxmedia.s3.amazonaws.com/art...08-2016eu4.png
The EUR/USD broke the resistance trend line (dotted) as expected in yesterday's wave analysis. The bullish move is part of a larger contracting triangle chart pattern (ABCDE green).
1 hour https://fxmedia.s3.amazonaws.com/art...08-2016eu1.png
The EUR/USD broke the resistance (dotted) with strong momentum, which could indicate that it was a wave 3 (orange). In that case a wave 4 and 5 (orange) could unfold soon. The wave 4 (orange) structure is invalidated if price moves below the 78.6% Fibonacci level of wave 4 vs 3.
EUR/USD
4 hour https://fxmedia.s3.amazonaws.com/art...08-2016eu4.png
The EUR/USD is in a bullish momentum which is part of a larger contracting triangle chart pattern (ABCDE green).
1 hour https://fxmedia.s3.amazonaws.com/art...08-2016eu1.png
The EUR/USD showed a retracement back towards the 50% and 61.8% Fibonacci retracement level which completed wave 4 (orange). The wave 5 (orange) is heading towards the Fibonacci targets.
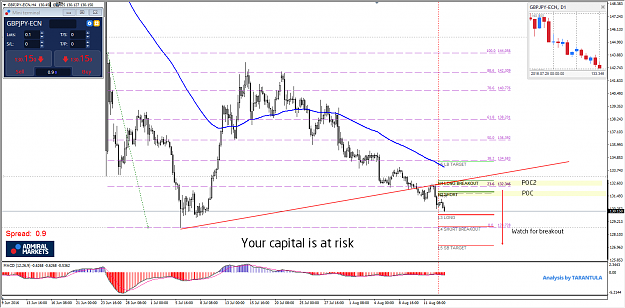
GBP/USD
4 hour https://fxmedia.s3.amazonaws.com/art...08-2016gu4.png
The GBP/USD is either completing a wave 5 (blue) or extending the wave 5 (blue) with an internal 5 wave indicated by wave 1-2 (pink). A break below the previous bottom (green) is needed before an extension of the downtrend is confirmed.
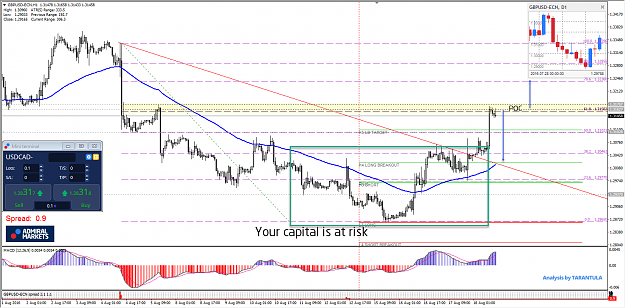
1 hour https://fxmedia.s3.amazonaws.com/art...08-2016gu1.png
The GBP/USD indeed completed a wave B (green) correction and is moving higher as part of the wave C (green). A break of the resistance trend line (orange) or retest and bounce at the support trend line (green) could lead to bullish continuation towards the Fibonacci targets.
EUR/USD
4 hour https://fxmedia.s3.amazonaws.com/art...08-2016eu4.png
The EUR/USD continued its strong bullish momentum yesterday and throughout the week. This seems to have completed an impulsive wave 3 (green) and one more push higher (wave 5 green) could occur if a corrective wave 4 (green) pattern develops.
1 hour https://fxmedia.s3.amazonaws.com/art...08-2016eu1.png
The EUR/USD could bounce at the Fibonacci levels of wave 4 (green). A break below the 61.8% Fibonacci level and trend line (green) invalidates the wave 4 (green).
GBP/USD
4 hour https://fxmedia.s3.amazonaws.com/art...08-2016gu4.png
The GBP/USD is either completing a wave 5 (blue) or extending the wave 5 (blue) with an internal 5 wave indicated by wave 1-2 (pink). Price has not reached the 61.8% Fibonacci level of wave 2 vs 1 but a break above the 100% Fib level invalidates the pink 1-2. A break below the previous bottom (green) is needed before an extension of the downtrend is confirmed.
1 hour https://fxmedia.s3.amazonaws.com/art...08-2016gu1.png
The GBP/USD broke the resistance trend line (orange) yesterday and showed bullish impulsiveness as expected within the wave C (green) zigzag. Price could now bounce at the Fibonacci levels of wave 4 (blue) but a break below the 61.8% Fibonacci level, however, invalidates the wave 4 (green).