Market Profile is like the descriptive statistics of the financial market.
If you are not sure what is the descriptive statistics then you can have a look what they are in terms of a statistical point view.
https://en.wikipedia.org/wiki/Descriptive_statistics
Really sorry for the people do not like math. For trading and if you want to become a professional trader, then it is better for you to cover some basic math at least (I am talking about basic math). It is matter of your survival skills and for your longevity in your investment.
When you use Market Profile,
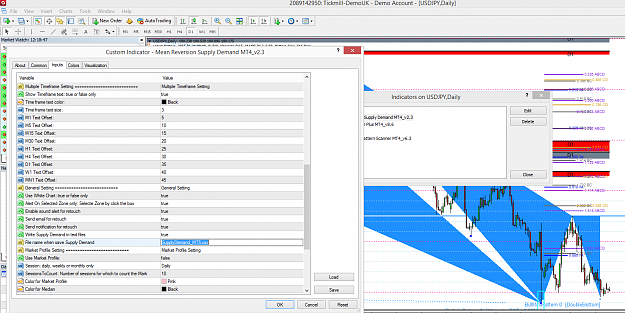
TPO TPO or Time Price Opportunity is the basic building block of Market Profile. Each and every letter in the chart represents a TPO. Which in turn represents a point of time where the market touches a price. Each consecutive letter denotes a 30min period of Market Activity. In our example as shown below the letter A represents how the price traded for the first 30min. Letter B represents next 30min of activity. And Letter C and D represents subsequent market activity details and so on.
TPO Size : Practically speaking we need to define the size of TPO to make sure that your entire profile is visible. Generally one can try in Nifty Futures with TPO Size of 3 which mean each and every letter represents a block of 3 points in Nifty Futures. And TPO Size should depend upon the Trading Instrument. For greater accuracy of Key reference levels it is advisable to use TPO size as less as possible but with higher TPO Size more historical data can be seen and key reference levels out of range can be seen with higher TPO Size.
Initial Balance (IB) : Initial Balance represents the first hour of trade. Typically the high and low range of the letters A & B. Longer the length of the Initial Balance stronger the conviction of Long term and Short term players.
Point of Control : Point of control is the price where most of the trade for the day happens. In other words the price where more number of TPOs in a row. Todays ongoing POC levels are represented as DPOC (Developing POC) and Yesterdays POC (YPOC) and Previous POC levels are plotted as dotted green lines as shown above.
Value Area : Value Area is the fair price zone where the Other Timeframe Players (Long Term players and Shorter Term Players) loves to trade in this zone. 70% of the days trading happens here.
Value Area High (VAH) The upper level of value area. (upper Red Bracket Level). YVAH Yesterdays value area high is marked as Red Dotted Line.
Value Area Low (VAL) The lower level of value area. (Lower Red Bracket Level). YVAL Yesterdays value area high is marked as Blue Dotted Line.
Single Prints : When there is only one TPO in a Row. From the above picture you can identify that Letter D and L are single prints.
Range : High-Low range for the day
Open Range : First 10 minutes of the market movement range. It is represented as the Blue Vertical lines in the Initial Balance (IB)
Range Extension An extension of price above or below the initial balance.
High Value Node (HVN) : An HVN is a price area of high TPO count or volume. The market traded for a long time at this level. These often form support or resistance levels when the price re-visits the area.
Low Value Node (LVN) : An LVN is a price area of low TPO count or volume. The market did not trade for very long time at this level. These often form support or resistance levels when the price re-visits the area.
https://algotradinginvestment.wordpr...arket-profile/
https://algotradinginvestment.wordpr...arket-profile/

If you are not sure what is the descriptive statistics then you can have a look what they are in terms of a statistical point view.
https://en.wikipedia.org/wiki/Descriptive_statistics
Really sorry for the people do not like math. For trading and if you want to become a professional trader, then it is better for you to cover some basic math at least (I am talking about basic math). It is matter of your survival skills and for your longevity in your investment.
When you use Market Profile,
TPO TPO or Time Price Opportunity is the basic building block of Market Profile. Each and every letter in the chart represents a TPO. Which in turn represents a point of time where the market touches a price. Each consecutive letter denotes a 30min period of Market Activity. In our example as shown below the letter A represents how the price traded for the first 30min. Letter B represents next 30min of activity. And Letter C and D represents subsequent market activity details and so on.
TPO Size : Practically speaking we need to define the size of TPO to make sure that your entire profile is visible. Generally one can try in Nifty Futures with TPO Size of 3 which mean each and every letter represents a block of 3 points in Nifty Futures. And TPO Size should depend upon the Trading Instrument. For greater accuracy of Key reference levels it is advisable to use TPO size as less as possible but with higher TPO Size more historical data can be seen and key reference levels out of range can be seen with higher TPO Size.
Initial Balance (IB) : Initial Balance represents the first hour of trade. Typically the high and low range of the letters A & B. Longer the length of the Initial Balance stronger the conviction of Long term and Short term players.
Point of Control : Point of control is the price where most of the trade for the day happens. In other words the price where more number of TPOs in a row. Todays ongoing POC levels are represented as DPOC (Developing POC) and Yesterdays POC (YPOC) and Previous POC levels are plotted as dotted green lines as shown above.
Value Area : Value Area is the fair price zone where the Other Timeframe Players (Long Term players and Shorter Term Players) loves to trade in this zone. 70% of the days trading happens here.
Value Area High (VAH) The upper level of value area. (upper Red Bracket Level). YVAH Yesterdays value area high is marked as Red Dotted Line.
Value Area Low (VAL) The lower level of value area. (Lower Red Bracket Level). YVAL Yesterdays value area high is marked as Blue Dotted Line.
Single Prints : When there is only one TPO in a Row. From the above picture you can identify that Letter D and L are single prints.
Range : High-Low range for the day
Open Range : First 10 minutes of the market movement range. It is represented as the Blue Vertical lines in the Initial Balance (IB)
Range Extension An extension of price above or below the initial balance.
High Value Node (HVN) : An HVN is a price area of high TPO count or volume. The market traded for a long time at this level. These often form support or resistance levels when the price re-visits the area.
Low Value Node (LVN) : An LVN is a price area of low TPO count or volume. The market did not trade for very long time at this level. These often form support or resistance levels when the price re-visits the area.
https://algotradinginvestment.wordpr...arket-profile/
https://algotradinginvestment.wordpr...arket-profile/
Attached Image (click to enlarge)