• Home
  • Forums
  • Trades
  • News
  • Calendar
  • Market
  • Brokers
  • Login
  • Join
  • User/Email: Password:
  • 7:41am
Menu
  • Forums
  • Trades
  • News
  • Calendar
  • Market
  • Brokers
  • Login
  • Join
  • 7:41am
Sister Sites
  • Metals Mine
  • Energy EXCH
  • Crypto Craft

Options

Bookmark Thread

First Page First Unread Last Page Last Post

Print Thread

Similar Threads

TMA CG MTF Oscillator 0 replies

Mtf accelerator oscillator 12 replies

Awesome Oscillator MTF Tape 3 replies

MTF-OnChart-Stochastic Oscillator 0 replies

Need Alert for MTF Awesome Oscillator AO 10 replies

  • Platform Tech
  • /
  • Reply to Thread
  • Subscribe
  • 80
Attachments: MT4 MTF Correlation table and Correlation oscillator indicators
Exit Attachments
Tags: MT4 MTF Correlation table and Correlation oscillator indicators
Cancel

MT4 MTF Correlation table and Correlation oscillator indicators

  • Last Post
  •  
  • 1 345Page 67 8
  • 1 5Page 67 8
  •  
  • Post #101
  • Quote
  • Aug 4, 2016 9:43pm Aug 4, 2016 9:43pm
  •  9047
  • Joined Jun 2011 | Status: Nominal | 304 Posts
Quoting friska
Disliked
nicee work here!! thanks for sharing!
Ignored
Thank you! Have an awesome weekend.
 
 
  • Post #102
  • Quote
  • Aug 4, 2016 10:09pm Aug 4, 2016 10:09pm
  •  hukam
  • Joined Mar 2012 | Status: Member | 1,222 Posts
@ninety47
 
 
  • Post #103
  • Quote
  • Aug 5, 2016 12:36am Aug 5, 2016 12:36am
  •  cjtylor
  • | Joined Jan 2015 | Status: Member | 168 Posts
Quoting 9047
Disliked
{quote} Apologies I missed your post. You can use it how you see fit. I using the correlation measures for risk management when swing trading (e.g. altering position size for example it a long set up occurs in USDJPY and a short setup in EURUSD ... I don't want to be double my exposure in the USD). I also have an automated strategy that works, generally, on the ideas that Zelo mentioned but it doesn't run on MT4. Its worth noting that you can generally see the correlations but just looking at charts. The idea behind display multiple time frames...
Ignored
ya - i think the theory is sound - but i am just not sure how practically trade correlation.
when correlation is 80%, and i think it's high enough, it can get higher .
Anyway, do you have a way to only short/long correlation - without any spot price exposure?
Thanks alot mate.
 
 
  • Post #104
  • Quote
  • Aug 6, 2016 2:32am Aug 6, 2016 2:32am
  •  Brommer
  • | Joined Jul 2016 | Status: Member | 7 Posts
Quoting 9047
Disliked
Spent a couple of hours on this yesterday. Still couldn't recreate the errors but I did rewrite the table view so new releases (skipping 1.22 to 1.23). Test it if you are interested.
Ignored
Sorry had no time last week. So here goes (we're still talking about v1.2; i haven't looked at the new one yet, so i guess this is FYI only):

First of all i created a template so it has all the settings i want, including all 28 pairs, as i don't want to type in every single one each time i attach it to a chart. Hence because of this there will always be one that matches the pair of the chart i attach it to. OK fine.

1. then i open a random chart, say, EURUSD.
2. attach the above template
3. go to the indicator properties and delete all pairs, except the EURUSD (as i wanted to see what was underneath the double printed line; and obviously the values of EURUSD on a EURUSD chart should all be 1, it shouldn't calculate anything)
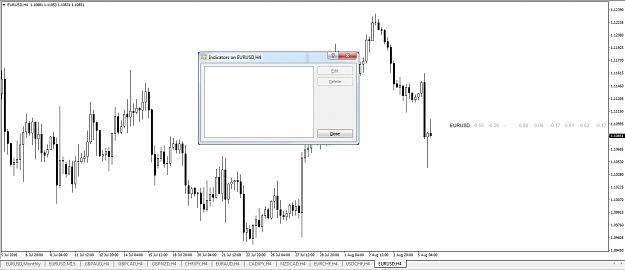
4. result is the attached chart
5. Now you can see that it has removed the indicator from the list as well
Attached Image (click to enlarge)
Click to Enlarge

Name: EURUSD.jpg
Size: 133 KB
 
 
  • Post #105
  • Quote
  • Edited 8:34pm Aug 7, 2016 8:19pm | Edited 8:34pm
  •  9047
  • Joined Jun 2011 | Status: Nominal | 304 Posts
No worries mate. We have lives
Thank you very much for the feedback.

I can't replicate the one you just posted but I can get the "overwriting" happing when I use templates - not something I was testing with.

Sure is an odd one and its still happening with v1.2.3. I'll do some poking around and figure it out.

9047.

EDIT: Got the error.... man MT4 loves to have weird ass bugs in really places the debugger can't tread.

2nd EDIT: So it occurs when you apply the template to a symbol other than the template you originally created the symbol. It definitely has something to do with confusion over what the chart symbol is and the fact that templates hold onto chart objects. I have a solution in mind that should solve the problem.... but like most things in MT4 it ends up being a bit hacky and leaves you feeling dirty and question why you use the platform (oh yeah the essentially free data).
 
 
  • Post #106
  • Quote
  • Aug 7, 2016 9:14pm Aug 7, 2016 9:14pm
  •  9047
  • Joined Jun 2011 | Status: Nominal | 304 Posts
Source of the problem found.

When you save a template it saves all the chart objects (hidden or otherwise). Extract from the template file I created...
Inserted Code
<chart>
id=131043774429655163
symbol=EURUSD
period=60
leftpos=4121
digits=5
scale=8
graph=1
fore=0
.
.
.
</chart>
.
.
.
<object>
type=23
object_name=CORR_LABEL_SYMBOL_AUDUSD
period_flags=0
create_time=1470616138
description=AUDUSD
color=16777215
font=Lucida Console
fontsize=9
angle=0
anchor_pos=0
background=0
filling=0
selectable=0
hidden=1
zorder=0
corner=0
x_distance=1303
y_distance=45
</object>
<object>
type=23
object_name=CORR_VALUE_AUDUSD_M5
period_flags=0
create_time=1470616138
description= 0.39
color=16760576
font=Lucida Console
fontsize=9
angle=0
anchor_pos=0
background=0
filling=0
selectable=0
hidden=1
zorder=0
corner=0
x_distance=1352
y_distance=45
</object>
.
.
.

I created this particular template on a EURUSD chart and so when it is applied to a new, for example AUDUSD, chart it recreates all the objects listed in the template's "XML" file. This is fine for all the other symbols aren't EURUSD because their chart objects are re-created and re-positioned but the existing "AUDUSD" chart objects aren't created by the template but even though they aren't needed! What a turd
 
 
  • Post #107
  • Quote
  • Aug 7, 2016 9:29pm Aug 7, 2016 9:29pm
  •  9047
  • Joined Jun 2011 | Status: Nominal | 304 Posts
New release v1.2.4

Change log:

  1. fixed the bug found by Brommer. Cause of the bug was how MT4 templates hand chart objects. This bug fix also allows for changes that include removing or adding time periods to the chart.
  2. Re-ordered the input parameters so the symbol list comes first (saves some scrolling).

Build notes:

  1. Tested on MT4 Build 988 (14 July 2016) (under Windows 10, running under Virtual Box).
  2. Compiled using version 5.00 build 1351 (4 July 2016) of Meta Editor.

Known issues:

  1. Data loading is still a problem. At present any errors will simply display "#ERR#".
  2. It will also display "#ERR#" in the event of a division by zero (or a value significantly close to zero).

Attached Image (click to enlarge)
Click to Enlarge

Name: 1.2.4_release.png
Size: 123 KB
Attached File(s)
File Type: ex4 ninety47_CorrelationTable_v1.2.4.ex4   37 KB | 1,024 downloads
 
 
  • Post #108
  • Quote
  • Aug 7, 2016 10:03pm Aug 7, 2016 10:03pm
  •  9047
  • Joined Jun 2011 | Status: Nominal | 304 Posts
Quoting gomen
Disliked
ninety47_CorrelationTable_v1.2.3.ex4 Not work on USDJPY ?
Ignored
Gomen how did you get on?
Did you get the indicator working?
 
 
  • Post #109
  • Quote
  • Aug 7, 2016 10:25pm Aug 7, 2016 10:25pm
  •  9047
  • Joined Jun 2011 | Status: Nominal | 304 Posts
Quoting cjtylor
Disliked
{quote} ya - i think the theory is sound - but i am just not sure how practically trade correlation. when correlation is 80%, and i think it's high enough, it can get higher . Anyway, do you have a way to only short/long correlation - without any spot price exposure? Thanks alot mate.
Ignored
There are a couple of options but in short you don't really "trade" it like you would an indicator.

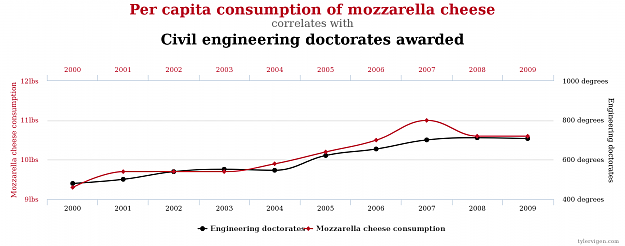
Generally when correlation is up around 80% (or 0.8) in means two time series are moving in the same direction or if you have -80% (-0.8) they are moving similarly but in opposite directions. The key part to remember is that correlation does not imply causation for example there is strong correlation between per capita consumption of mozzarella cheese in the United States and the awarding of civil engineering doctorates in the United States. Obviously this is a spurious correlation. But given the currency market (and all its pairs) are essentially one big beast you can exploit the apparent correlations and deviations from them.

Attached Image (click to enlarge)
Click to Enlarge

Name: chart.png
Size: 100 KB

Source http://www.tylervigen.com/spurious-correlations

Zelo mentioned some useful ideas in his post above.

Similarly if you are a swing trader or levels trader and you have nice levels across 3 highly correlated pairs then you can use the information to manage your exposure by only trading one of the levels (which one you trade and why is another story completely).

But essentially correlations below 0.8 should be interpreted as uncorrelated (but remember they are changing all the time so it could be going up or down).

Hope that helps.

9047.
 
 
  • Post #110
  • Quote
  • Aug 18, 2016 7:25am Aug 18, 2016 7:25am
  •  Synertic
  • | Joined Sep 2008 | Status: Member | 2 Posts
The problem above is arisen from the fact that a serie like EURUSD is not a stationary process depending on time (that is; mean and variance of the serie is not constant and changing depending on time) and a statistical parameter like pearson corr. may not be reflected the true relitionships in the situation, espicially when the result are high correlecation values. In addition to this, a non-stationary serie could be made stationary thanks to calculating its return values with difference operator;

D(EURUSD) = Ln(EURUSD)-Ln(EURUSD(t-1)) and;
D(USDJPY) = Ln(USDJPY)-Ln(USDYJPY(t-1))

or

D(EURUSD) = (EURUSD(t))-Ln(EURUSD(t-1)) and;
D(USDJPY) = (USDJPY(t))-(USDYJPY(t-1))

t: indicates time by frame in this demonstration so if the frame is 1H for example. t: is the current time and t-1: is one hour ago depending on current time.

This process is also called as de-trending So when all difference (return) values is calculated as above, then Corr(D(EURUSD), D(USDJPY)) series must be reflect the true relitionships between EURUSD and USDJPY themselves because a "spurious random common" trend like above graph is now excluded from both cross and the mean and variance is constant depending on the time now. I think an approach like this could be added as an option if it won't cause a burden on 9047's shoulders.

I hope I could make a little contrubition to the topic.

and lastly, when I drag and drop the indicators in the chart, nothing happens. No any message or something. DLL option is checked. Ver 4 b988 (4 July 2016). Any comments? Could anybody please show his/her folder structure via some screenshots to assure mine is true?

thanks,
 
 
  • Post #111
  • Quote
  • Aug 19, 2016 9:19am Aug 19, 2016 9:19am
  •  9047
  • Joined Jun 2011 | Status: Nominal | 304 Posts
2 items to respond to...

First item: Technical issue
Quoting Synertic
Disliked
.....and lastly, when I drag and drop the indicators in the chart, nothing happens. No any message or something. DLL option is checked. Ver 4 b988 (4 July 2016). Any comments? Could anybody please show his/her folder structure via some screenshots to assure mine is true? thanks,
Ignored
No idea. Haven't had any issues with this myself and I'm using the same build as you.

That said, I did notice if you drop, or add, the indicator on a chart that it is already on it all falls apart. I am pretty sure I can add some hacks to fix this issue but coding to defend against acts of stupidity (even though I did it myself ) is a low priority.


Second item: Detrending FX data
Quoting Synertic
Disliked
The problem above is arisen from the fact that a serie like EURUSD is not a stationary process depending on time (that is; mean and variance of the serie is not constant and changing depending on time) and a statistical parameter like pearson corr. may not be reflected the true relitionships in the situation, espicially when the result are high correlecation values. In addition to this, a non-stationary serie could be made stationary thanks to calculating its return values with difference operator;
D(EURUSD) = Ln(EURUSD)-Ln(EURUSD(t-1)) and;
D(USDJPY)...
Ignored
Its a great and welcome contribution. Give me some time to think about it, in terms of its implementation, and I'll get back to you.

Something that does come to mind immediately is that the first order difference may not be sufficient to transform to affect the stationarity of the time-series. Under ideal circumstances the n-th order difference would be required, where the n-th difference minimises the variance of the stationary time-series. I'll investigate more about the impact of the logarithmic transform as well. Its also worth noting that "n" (as in the order of the difference required to make the time series stationary will be a moving target.

In the mean time do you have any analysis/results you can show for detrending the currency data using first or n-th order differences?

9047.
 
 
  • Post #112
  • Quote
  • Aug 19, 2016 3:34pm Aug 19, 2016 3:34pm
  •  Synertic
  • | Joined Sep 2008 | Status: Member | 2 Posts
Hi Again,

currently I don't have any analysis on it but as a person who studied on time series analysis for 6 years that I can clearly say that 1st difference is enough for %99 of the time to provide stationary of a data like a crosspair. Upper order differrences are needed for just %1 of the time and for a spesific non-linear series. In the light of this let me explain some things more detailed.

The first preassumption of correlation is that there are two series and you know that these series are in a relitionship or you have clearly signs that there may be a relitionship with each other. So if you clearly know that cheese consumption and phd numbers are obviously unrelated then you do not need to calculate an statistic like a pearson in order to show that it is wrong. The wrong thing is not the pearson corr for this example but the logic itself. The logical disorder for the subject web site is exactly that the site used series which are exactly known that they are unrelated with each other. You don't need to calculate any stats if you know there is no any relitionship between to variables. The corr stat is calculed for either known relitionships or heavy suspicions that there may be a relitionships.

So befero de-trending (called as level series) you know that USDJPY and EURUSD in a relitionship according to global currency supply and demand levels. And if you clearly know that these are in a relitionship then you can calculate the p corr just like you do. But let me enhance the things a little more. What is the difference between level series (USDJPY and EURUSD) and de-trended series (D(USDJPY) and D(EURUSD)). I can clearly say that the answer is the 'time'. You find "long run" relitionships for the crosses and selected time frame if you use level series and you find "short run" relitionships for the subject crosses and timeframe if you use differencial or de-trended series. The ultimate difference of the stats is "the duration of effects". So you can seperate the stats for "long-run" and "short-run" correlations using corrs of level and differanciated series. Do not worry about spurios relitionships like the graph you showed because you clearly know that currency supply and demands in the global economic system are not independend of each others and common long-run trens are not spurious for that reason. As I said, I'll post level and 1st ordered series' graphs if I find enough time to analyse them.
 
 
  • Post #113
  • Quote
  • Dec 10, 2016 12:33pm Dec 10, 2016 12:33pm
  •  Ramadas
  • Joined Oct 2009 | Status: Exploiting psychology of the crowds | 1,426 Posts
Quoting disbellj
Disliked
Hukam, Attached you should see what you wanted, although I didn't go through labor of writing this to excel file. What you need is on chart screen. Note: Correlation changes when timeframe changes, just like other ninety47 indicators that use the same function. Note2: Problem I was having before was using newer MT4 functions for indicator instead of older MT4 functions for init, deist and start. Kindest regards, Don {file} {image}
Ignored
Hi there, I hope you are still around. Can you or someone else give option to colour high correlation in red in your indicator?
Cut short your losses. Let your profits run on. David Ricardo (1772-1823)
 
 
  • Post #114
  • Quote
  • Edited 10:06am Dec 11, 2016 3:09am | Edited 10:06am
  •  9047
  • Joined Jun 2011 | Status: Nominal | 304 Posts
Quoting Ramadas
Disliked
{quote} Hi there, I hope you are still around. Can you or someone else give option to colour high correlation in red in your indicator?
Ignored
Hi Ramadas,

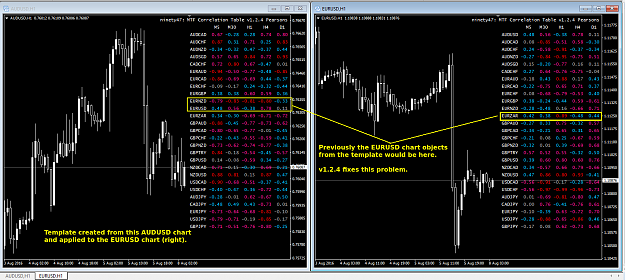
Sorry I may have misunderstood what you are asking but I think the indicator already does what your asking for. The image illustrates the correlations are highlighted according to their strength.

Attached Image


Off the top of my head I'm fairly certain the colours can be set in the input parameters.

Is this what you're after?

9047.
 
 
  • Post #115
  • Quote
  • Dec 11, 2016 7:42am Dec 11, 2016 7:42am
  •  spoy
  • | Joined Jul 2014 | Status: Member | 4 Posts
Hi 9047,
Can you please share the .mq4 file for version 1.2.4?
Thanks
 
 
  • Post #116
  • Quote
  • Dec 12, 2016 12:27am Dec 12, 2016 12:27am
  •  9047
  • Joined Jun 2011 | Status: Nominal | 304 Posts
Quoting spoy
Disliked
Hi 9047, Can you please share the .mq4 file for version 1.2.4? Thanks
Ignored
Sorry, but no.
 
 
  • Post #117
  • Quote
  • Dec 12, 2016 1:58am Dec 12, 2016 1:58am
  •  metatsock
  • | Commercial Member | Joined Dec 2006 | 997 Posts
Quoting spoy
Disliked
Hi 9047, Can you please share the .mq4 file for version 1.2.4? Thanks
Ignored
Here u can find a similar indicator

http://www.forexfactory.com/attachme...7&d=1428764356
 
1
  • Post #118
  • Quote
  • Dec 12, 2016 3:23am Dec 12, 2016 3:23am
  •  Ramadas
  • Joined Oct 2009 | Status: Exploiting psychology of the crowds | 1,426 Posts
Quoting 9047
Disliked
{quote} Hi Ramadas, Sorry I may have misunderstood what you are asking but I think the indicator already does what your asking for. The image illustrates the correlations are highlighted according to their strength. {image} Off the top of my head I'm fairly certain the colours can be set in the input parameters. Is this what you're after? 9047.
Ignored
Yes, but I was referring to Dan's mod, which puts in the table pairs against pairs, and not only current pair.
Cut short your losses. Let your profits run on. David Ricardo (1772-1823)
 
 
  • Post #119
  • Quote
  • Dec 12, 2016 6:36am Dec 12, 2016 6:36am
  •  spoy
  • | Joined Jul 2014 | Status: Member | 4 Posts
Quoting metatsock
Disliked
{quote} Here u can find a similar indicator http://www.forexfactory.com/attachme...7&d=1428764356
Ignored
Thanks.
 
 
  • Post #120
  • Quote
  • Edited 9:03am Dec 12, 2016 8:51am | Edited 9:03am
  •  9047
  • Joined Jun 2011 | Status: Nominal | 304 Posts
Quoting metatsock
Disliked
{quote} Here u can find a similar indicator http://www.forexfactory.com/attachme...7&d=1428764356
Ignored
Quoting spoy
Disliked
....
Ignored
@Metastock, thank you for providing the link.

@Spoy the primary reason I'm no longer making the source code available is that no one respects the GPL license the original version was released under. Apologies, but its just frustrating. If you need any help implementing spearman or pearson correlation function or with MQL4/5 please feel free to send me a PM.

I'll have some time later in the week to implement the detrending Synertic discusses above. This will released under version 1.3. I'm also aiming to breathe life back into the oscillator - I always found that to be a useful investigative tool.

9047.
 
 
  • Platform Tech
  • /
  • MT4 MTF Correlation table and Correlation oscillator indicators
  • Reply to Thread
    • 1 345Page 67 8
    • 1 5Page 67 8
1 trader viewing now
  • More
Top of Page
  • Facebook
  • Twitter
About FF
  • Mission
  • Products
  • User Guide
  • Media Kit
  • Blog
  • Contact
FF Products
  • Forums
  • Trades
  • Calendar
  • News
  • Market
  • Brokers
  • Trade Explorer
FF Website
  • Homepage
  • Search
  • Members
  • Report a Bug
Follow FF
  • Facebook
  • Twitter

FF Sister Sites:

  • Metals Mine
  • Energy EXCH
  • Crypto Craft

Forex Factory® is a brand of Fair Economy, Inc.

Terms of Service / ©2023