{quote} Keep up a useful work X. This way you may finish your book sooner than Mehdi. It would be good if you provide additional element with links (who and when advised this element). {quote} With another GMT offset time you should have anothe H4 & D1 open and close prices especially on H4. The picture will differ, indicators also would not match ... You may check system signals on any GMT+3 (Sydney time) broker (IC Markets, Global Prime ...) but trade anywhere you like.
Ignored
My guess (and hope) is that it would work on any GMT offset since Stoch and TDI would adapt to the different offset.
My first test will be on Method 1 Daily TF.
Still wondering how big the loss trades could be, trading the Daily candles...Time will tell...
Hi guys,
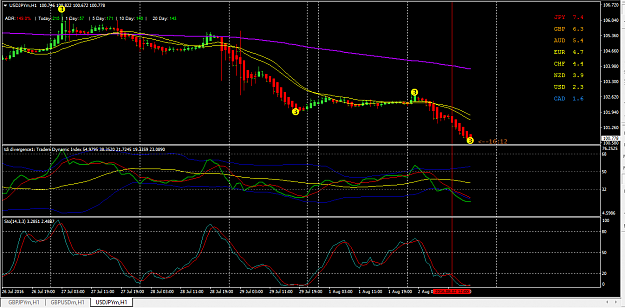
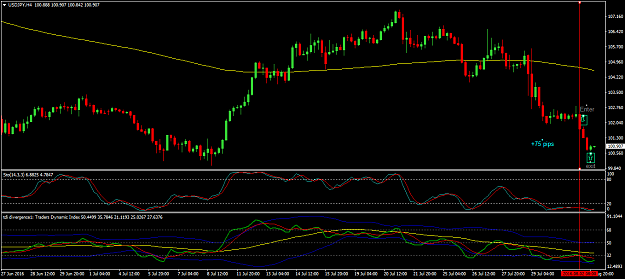
I entered this trade on USD/JPY 4H chart at the beginning of the candle with the arrow pointing down. I exited the trade at the close of the candle with the arrow pointing up as it looked to me that the move was getting a bit slower plus I thought it hit a good support area. The trade was +75 pips. I'm just curious if any of you took this trade or if you guys think this was a good/valid trade or do you think I simply got lucky. Thanks for your feedback.
Hi guys, I entered this trade on USD/JPY 4H chart at the beginning of the candle with the arrow pointing down. I exited the trade at the close of the candle with the arrow pointing up as it looked to me that the move was getting a bit slower plus I thought it hit a good support area. The trade was +75 pips. I'm just curious if any of you took this trade or if you guys think this was a good/valid trade or do you think I simply got lucky. Thanks for your feedback. {image}
Ignored
Hi pawelhc,
good trade, i'm still in it as well as in EURJPY. Live account.
{quote} My guess (and hope) is that it would work on any GMT offset since Stoch and TDI would adapt to the different offset. My first test will be on Method 1 Daily TF. Still wondering how big the loss trades could be, trading the Daily candles...Time will tell...
Ignored
You may control your loss in $ (money) by placing proper SL and calculating proper Lot size.
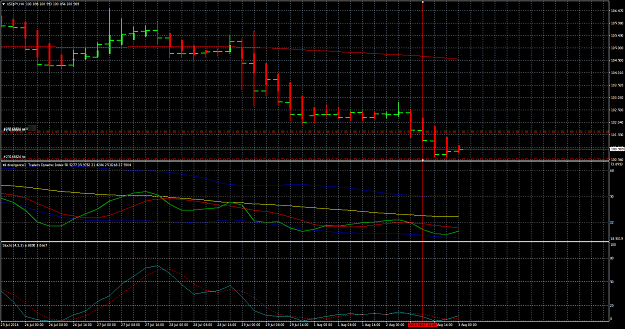
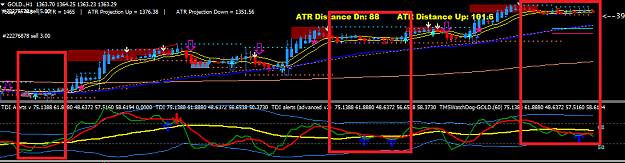
need some help to know is there anyway to avoid this kind of non moving trend ...
is there a good indicator ? or any way ?
i know to stay away after the market made a big move up or down...
any good advise guys ?
hello guy need some help to know is there anyway to avoid this kind of non moving trend ... is there a good indicator ? or any way ? i know to stay away after the market made a big move up or down... any good advise guys ? thanks and nice trading {image}
Ignored
HelloCould You tell me what is that indicator which insert the arrows to the graph? Could You share us? I mean the the buy and sell signal. Thank You!
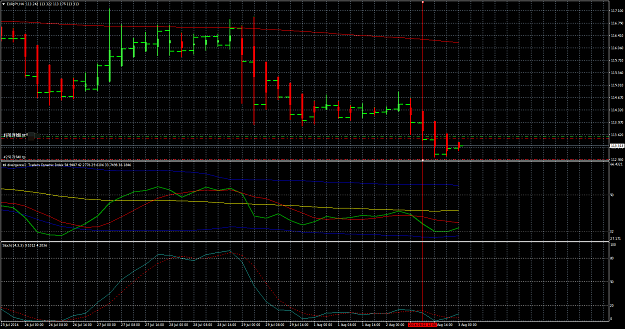
hello guy need some help to know is there anyway to avoid this kind of non moving trend ... is there a good indicator ? or any way ? i know to stay away after the market made a big move up or down... any good advise guys ? thanks and nice trading {image}
Ignored
The TDI will tell you. If the MBL is flat that is one indication also narrow VBs. The price line and signal line coiling around the MBL is another sign. To take a trade from there you need a strong cross with PL and SL showing good momentum as a setup and enter when the APB closes below/above the consolidation. Always look at the size of the previous APBs
Never argue with a fool; onlookers may not be able to tell the difference.
{quote} The TDI will tell you. If the MBL is flat that is one indication also narrow VBs. The price line and signal line coiling around the MBL is another sign. To take a trade from there you need a strong cross with PL and SL showing good momentum as a setup and enter when the APB closes below/above the consolidation. Always look at the size of the previous APBs
Ignored
thanks mate...but may i know know some of the meaning of ur short hard
MBL
VBs
PL and SL ...
What did I wrong?
Ignored