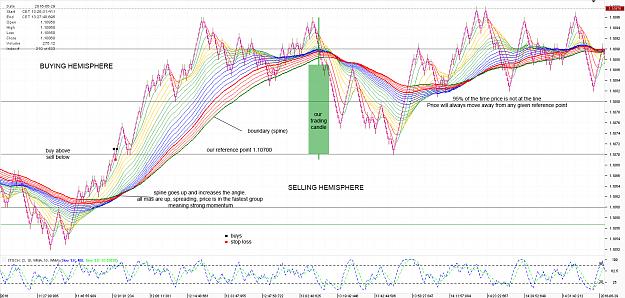
"95% of the time Price will close either above or below the opening price. Less than 5% of the time, Price will close at its opening price. Within this truth lies the pot of gold."
This statement has changed the way I look at the markets and charts forever. When I first read this it was the greatest enlightenment I ever had about trading. Most people do not see the enormous edge in this statement.
How can we apply this to actual trading?
The above statement is equivalent to:
Price will always move away from any given reference point.
Price will always be up or down, market never changes.
Price is always moving.
95% of the time price is not at the line, it is almost always around it.
Every candlestick on any chart proves this.
As above, So below.
I have a great respect for CrucialPoint and have read all of his posts many times. He wrote:
"This has nothing to do with price history nor historical data. This apply to every TF. But for simplicity, I want you to pull up any daily, weekly or a monthly chart. Look at the very last candlestick and understand this observation. Don't look the history, just the last candle. And then apply this theory to the future candlesticks without any historical analysis. I can guarantee you it will be 100% all of the time. I also dare you to prove me wrong on this.
The very first epiphany in trading was the discovery of "Buy above the line and Sell below the line". It is the equivalent of the invention of the wheel. Although this discovery was and still remain a closely guarded secret and will never be fully revealed. This concept was then developed and incorporated into the bar graph. The purpose of a bar is to create a reference point in time. Because the masters knew that price will always move away from any given reference point. And in doing so, only then a trader can take advantage of such movement to profit.
There is a secret (I shouldn't be using the word secret, but it is a secret). In the past they discovered that as long as you "buy above a line and sell below a line" that you actually have a greater statistical edge. Now this statistical edge was never released, and will never be released to the public. In discovering this powerful concept, they invented.... drum roll... The Candlestick. Have you ever wonder, when you have a line graph, why in the hell would you invent the candlestick!!! ? Clever Japanese people, they never did tell you why they invented it in the first place. Decades had past and then candlestick patterns were published... but this is not as powerful as the main core concept of the simple candlestick.
I would only draw a line. Anything above it I would buy. Anything below it I would sell.
If price is above the line, it is an uptrend. If price is below the line, it is a downtrend.
This is one of the best advice you will get: 1. Pick one side (buy or sell) 2. Find a reference point (only buy above and only sell below) 3. Only trade according to point 1."
But again, how do we use this ? What is the secret? I am trying to figure this out and have been thinking about this almost two years. This is my humble attempt to apply this theory and ask the ones that KNOW to correct me if I am doing something wrong.
Here it goes:
We only need a horizontal line and an appropriate market condition to be profitable. Every candlestick trades like this, we should trade like the candlestick trades. This is the simplest way of trading, and by my opinion the most powerful. We are going for the fast range expansion (candle), starting from a single line (reference point).
The open price mentioned is any price, a reference point, it doesn't have to be the open of any time frame usual candle. It is the open of our trading candle which starts at the moment we put on a trade, and closes when we close the trade(s) with profit. That's our candle.
1. We first define the BUY/SELL hemispheres. We only buy in the buy hemisphere, and we only sell in the sell hemisphere. The boundary between these hemispheres will be 200 wma (slowest ma on the chart, I call it spine) on a pure price chart without time. I use renko 1 pip chart, which shows clearly how the market moves, there are no hidden moves inside a candle, it shows every 1 pip move clearly. On this chart I can see easily the price moving away from any line. We define the market condition, is it uptrend or downtrend? Is it above or below our boundary(spine)? We see that it is in uptrend.
2. We define the momentum of the trend. The risk is smallest when we have strong momentum pushing our trade(s) - Law of motion. We want the price to move fast away from our trading line, this means we will have fewer losses. I define here the strong momentum this way:
-spine starts going up (in this case) with an increasing angle-slope. We don't even think of trading when the spine is flat.
-smaller mas are also going up and are above the spine, spreading from each other and forming the rainbow - meaning momentum is getting stronger
-we want the price to be in the yellow ma group (the fastest) above all previous ma groups that form the ma rainbow. I like the rainbow, it clearly shows the trend and momentum strength. We are targeting the 6th dimension by taking the trades in this ma group because we are in the market when all (relevant to us) trends are up. It is the fastest speed of the market, the 6th dimension. We only trade when the price is in this group.
3. When we have trend and strong momentum, we find a reference point from which we will trade. We find the reference point 1.10700. That is our horizontal line from which we will trade. We know that the price will always move away from this reference point. The only trades we will execute are buys 1 pip above 1.10700. Our stop is 1 pip below this line, risk of 2 pips. If we are stopped out we will re-enter again. We have an uptrend and strong momentum and we are taking trades in the direction of the trend with strong wind (momentum) that will move away the price fast from our trading line. If we trade when there is no momentum and trend present, we could be chopped to pieces. That is why the right market conditions are an essential part of trading.
That's it. Finding the right (fastest) market condition - trend and momentum and trade the horizontal line. Buy above, sell below. Simple. Price will always move away from the line - range expansion (candle), starting from a single line (reference point).
Is this a correct way of utilizing this theory? What do you guys think? CrucialPoint?
Thanks in advance.
This statement has changed the way I look at the markets and charts forever. When I first read this it was the greatest enlightenment I ever had about trading. Most people do not see the enormous edge in this statement.
How can we apply this to actual trading?
The above statement is equivalent to:
Price will always move away from any given reference point.
Price will always be up or down, market never changes.
Price is always moving.
95% of the time price is not at the line, it is almost always around it.
Every candlestick on any chart proves this.
As above, So below.
I have a great respect for CrucialPoint and have read all of his posts many times. He wrote:
"This has nothing to do with price history nor historical data. This apply to every TF. But for simplicity, I want you to pull up any daily, weekly or a monthly chart. Look at the very last candlestick and understand this observation. Don't look the history, just the last candle. And then apply this theory to the future candlesticks without any historical analysis. I can guarantee you it will be 100% all of the time. I also dare you to prove me wrong on this.
The very first epiphany in trading was the discovery of "Buy above the line and Sell below the line". It is the equivalent of the invention of the wheel. Although this discovery was and still remain a closely guarded secret and will never be fully revealed. This concept was then developed and incorporated into the bar graph. The purpose of a bar is to create a reference point in time. Because the masters knew that price will always move away from any given reference point. And in doing so, only then a trader can take advantage of such movement to profit.
There is a secret (I shouldn't be using the word secret, but it is a secret). In the past they discovered that as long as you "buy above a line and sell below a line" that you actually have a greater statistical edge. Now this statistical edge was never released, and will never be released to the public. In discovering this powerful concept, they invented.... drum roll... The Candlestick. Have you ever wonder, when you have a line graph, why in the hell would you invent the candlestick!!! ? Clever Japanese people, they never did tell you why they invented it in the first place. Decades had past and then candlestick patterns were published... but this is not as powerful as the main core concept of the simple candlestick.
I would only draw a line. Anything above it I would buy. Anything below it I would sell.
If price is above the line, it is an uptrend. If price is below the line, it is a downtrend.
This is one of the best advice you will get: 1. Pick one side (buy or sell) 2. Find a reference point (only buy above and only sell below) 3. Only trade according to point 1."
But again, how do we use this ? What is the secret? I am trying to figure this out and have been thinking about this almost two years. This is my humble attempt to apply this theory and ask the ones that KNOW to correct me if I am doing something wrong.
Here it goes:
We only need a horizontal line and an appropriate market condition to be profitable. Every candlestick trades like this, we should trade like the candlestick trades. This is the simplest way of trading, and by my opinion the most powerful. We are going for the fast range expansion (candle), starting from a single line (reference point).
The open price mentioned is any price, a reference point, it doesn't have to be the open of any time frame usual candle. It is the open of our trading candle which starts at the moment we put on a trade, and closes when we close the trade(s) with profit. That's our candle.
1. We first define the BUY/SELL hemispheres. We only buy in the buy hemisphere, and we only sell in the sell hemisphere. The boundary between these hemispheres will be 200 wma (slowest ma on the chart, I call it spine) on a pure price chart without time. I use renko 1 pip chart, which shows clearly how the market moves, there are no hidden moves inside a candle, it shows every 1 pip move clearly. On this chart I can see easily the price moving away from any line. We define the market condition, is it uptrend or downtrend? Is it above or below our boundary(spine)? We see that it is in uptrend.
2. We define the momentum of the trend. The risk is smallest when we have strong momentum pushing our trade(s) - Law of motion. We want the price to move fast away from our trading line, this means we will have fewer losses. I define here the strong momentum this way:
-spine starts going up (in this case) with an increasing angle-slope. We don't even think of trading when the spine is flat.
-smaller mas are also going up and are above the spine, spreading from each other and forming the rainbow - meaning momentum is getting stronger
-we want the price to be in the yellow ma group (the fastest) above all previous ma groups that form the ma rainbow. I like the rainbow, it clearly shows the trend and momentum strength. We are targeting the 6th dimension by taking the trades in this ma group because we are in the market when all (relevant to us) trends are up. It is the fastest speed of the market, the 6th dimension. We only trade when the price is in this group.
3. When we have trend and strong momentum, we find a reference point from which we will trade. We find the reference point 1.10700. That is our horizontal line from which we will trade. We know that the price will always move away from this reference point. The only trades we will execute are buys 1 pip above 1.10700. Our stop is 1 pip below this line, risk of 2 pips. If we are stopped out we will re-enter again. We have an uptrend and strong momentum and we are taking trades in the direction of the trend with strong wind (momentum) that will move away the price fast from our trading line. If we trade when there is no momentum and trend present, we could be chopped to pieces. That is why the right market conditions are an essential part of trading.
Attached Image (click to enlarge)
That's it. Finding the right (fastest) market condition - trend and momentum and trade the horizontal line. Buy above, sell below. Simple. Price will always move away from the line - range expansion (candle), starting from a single line (reference point).
Is this a correct way of utilizing this theory? What do you guys think? CrucialPoint?
Thanks in advance.