• Home
  • Forums
  • Trades
  • News
  • Calendar
  • Market
  • Brokers
  • Login
  • Join
  • User/Email: Password:
  • 4:25pm
Menu
  • Forums
  • Trades
  • News
  • Calendar
  • Market
  • Brokers
  • Login
  • Join
  • 4:25pm
Sister Sites
  • Metals Mine
  • Energy EXCH
  • Crypto Craft

Options

Bookmark Thread

First Page First Unread Last Page Last Post

Print Thread

Similar Threads

How to flow with the order flow? 26 replies

What is order flow trading? 90 replies

Order flow trading thread 166 replies

Domino's Price and order flow trading 1,400 replies

Order Flow Trading with ICCE Channels 3 replies

  • Commercial Content
  • /
  • Reply to Thread
  • Subscribe
  • 7,344
Attachments: Trading Institutional Order Flow
Exit Attachments

Trading Institutional Order Flow

  • Last Post
  •  
  • 1 3233Page 343536 498
  • 1 Page 34 498
  •  
  • Post #661
  • Quote
  • Jun 14, 2016 3:14pm Jun 14, 2016 3:14pm
  •  conom589
  • | Joined Apr 2015 | Status: Member | 157 Posts
Quoting hadi_20
Disliked
hello there everybody and ark for his great work i test a lot of strategies mostly price action.now in consider that the base of every market inculing fx market is laid on supply and demand and orders which creates this zones.because supply demand make the market and moves and if there is no supply demand there is no market. so i find this topic interesting and will read all pages one by one to figure out the consepts of s-d by the examples given in this thread i notice the examples given by ark are 3 color candles rather than 2 colors(1 for bullish...
Ignored
Arc?

Who is Mr. Arc?
 
 
  • Post #662
  • Quote
  • Jun 14, 2016 3:50pm Jun 14, 2016 3:50pm
  •  hadi_20
  • | Joined Nov 2011 | Status: Member | 23 Posts
Quoting conom589
Disliked
{quote} Arc? Who is Mr. Arc?
Ignored
ohhh what a mistake i made
i apologize i mean akt
 
 
  • Post #663
  • Quote
  • Jun 15, 2016 1:34am Jun 15, 2016 1:34am
  •  Akt
  • | Commercial Member | Joined Jan 2016 | 2,625 Posts
Quoting hadi_20
Disliked
hello there everybody and akt for his great work i test a lot of strategies mostly price action.now in consider that the base of every market inculing fx market is laid on supply and demand and orders which creates this zones.because supply demand make the market and moves and if there is no supply demand there is no market. so i find this topic interesting and will read all pages one by one to figure out the consepts of s-d by the examples given in this thread i notice the examples given by ark are 3 color candles rather than 2 colors(1 for bullish...
Ignored

Hello hadi_20. Good to meet you. Welcome.

I use a tool on trading view to highlight candles i refer to as 50% candles. I don't necessarily need them but they are cool colors and i like the feel they give my charts.
Old habits die hard i guess.

I hope the thread helps you.

best wishes
Be careful what you think because your thoughts run your life..Solomon
 
 
  • Post #664
  • Quote
  • Jun 15, 2016 1:38am Jun 15, 2016 1:38am
  •  Akt
  • | Commercial Member | Joined Jan 2016 | 2,625 Posts
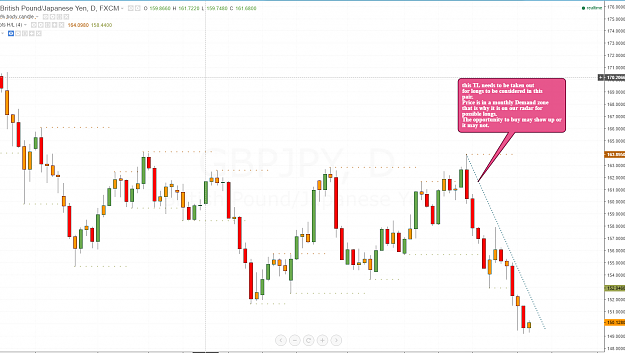
Good morning everyone.

GBPJPY Update

best wishes
Attached Image (click to enlarge)
Click to Enlarge

Name: gbpjpy trend line.PNG
Size: 103 KB
Be careful what you think because your thoughts run your life..Solomon
 
 
  • Post #665
  • Quote
  • Jun 15, 2016 3:14am Jun 15, 2016 3:14am
  •  autaret
  • | Joined Aug 2007 | Status: Member | 182 Posts
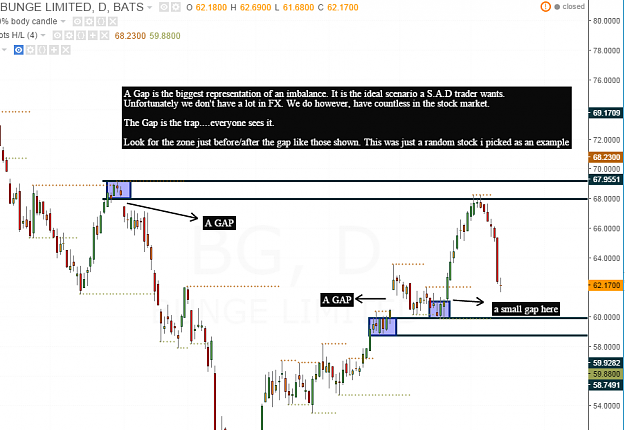
Hi Akt and thanks again for your wonderful work here. It's about one month I'm nicely incorporating the SD ideas in my analysis (as a weekly trader).
Please I need more informations about the treatement of gaps in SD metodology. This question becouse I trade just stock indices while you usually show example of forex pairs where gaps are not so frequent. It's not totally clear for me how to trace a base before or after a gap occours, if you could show me/us a chart example thank you in advance.
 
 
  • Post #666
  • Quote
  • Edited at 5:16am Jun 15, 2016 3:46am | Edited at 5:16am
  •  argon
  • | Joined Feb 2010 | Status: Member | 157 Posts
Quoting Lade
Disliked
{quote} I really appreciate you ARGON. But i will like to inform you that you came to a wrong platform to showcase or advertise your business. No doubt there are lot of things that people came to do at Forex Factory. but, it might interest you that Trading Institutional Order Flow is purely and mainly for TRADING. please i will like to inform you that all of the rules of this thread against advertisement of your business in any form. Please with all humility if you are interested in trading Forex, Future, Stocks etc you are welcome. Regards.
Ignored
Lade you are totally silly wrong coz thats not my business at all! just thought that I might help Akt, but if not its OK its fine then ! beside I am sure Akt can talk for him self n dont need you as spokesman right? I really didnt know that wanting to help someone is that offensive ? rude maybe? dont understand what r u talking about ?
happy life
btw.n trading instructional order flow is as trading support and resistance levels more less...n market is highly controlled as casinos, so dont bother and all is about SL hunting and Smart Money + HFT (who only was inside in real order flow i.e. they create it!)
 
 
  • Post #667
  • Quote
  • Jun 15, 2016 5:47am Jun 15, 2016 5:47am
  •  hadi_20
  • | Joined Nov 2011 | Status: Member | 23 Posts
thank you akt for the reply thats very kind of you.i am trying to fugure out how to locate sz and dz in the chart with the help of the examples you post.
i am totally new.there must be rules to indicate sz dz.could you refer me to some reference about the rules and your vids.

also i have a q
just like old support new resistance rule can we tell this about sz and dz?like this "old sz which have been broken is now new dz"
 
 
  • Post #668
  • Quote
  • Jun 15, 2016 7:38am Jun 15, 2016 7:38am
  •  Akt
  • | Commercial Member | Joined Jan 2016 | 2,625 Posts
Quoting autaret
Disliked
Hi Akt and thanks again for your wonderful work here. It's about one month I'm nicely incorporating the SD ideas in my analysis (as a weekly trader). Please I need more informations about the treatement of gaps in SD metodology. This question becouse I trade just stock indices while you usually show example of forex pairs where gaps are not so frequent. It's not totally clear for me how to trace a base before or after a gap occours, if you could show me/us a chart example thank you in advance.
Ignored
Hello autaret. Welcome back. Been a little while.

The way to treat gaps in any market using the methodology is exactly the same. We look for them and treat them as the biggest representations of the imbalances we like to trade.
Where a gap is located as always, is paramount. Remember to always do the top down and not just taking a trade because of a gap. (I know you know that already).

Here is a random stock I picked when i saw your question. No prior analysis, just looking at the gaps to answer your question pictorially

best wishes
Attached Image (click to enlarge)
Click to Enlarge

Name: bg gap.PNG
Size: 61 KB
Be careful what you think because your thoughts run your life..Solomon
 
 
  • Post #669
  • Quote
  • Jun 15, 2016 7:45am Jun 15, 2016 7:45am
  •  Akt
  • | Commercial Member | Joined Jan 2016 | 2,625 Posts
Quoting hadi_20
Disliked
thank you akt for the reply thats very kind of you.i am trying to fugure out how to locate sz and dz in the chart with the help of the examples you post. i am totally new.there must be rules to indicate sz dz.could you refer me to some reference about the rules and your vids. also i have a q just like old support new resistance rule can we tell this about sz and dz?like this "old sz which have been broken is now new dz"
Ignored
Hello hadi_20. Thank you for your questions
Please look through my posts and those of other traders here. The way to identify zones are documented in here somewhere. You will probabaly see them as you go along reading the thread.

Regarding the second part of your question, correct, there is a similarity between the support and resistance concept of old resistance becomes support and old support becomes resistance, with the Supply and demand concept of Flip/swap zones.

That is all it is, a similarity. They are actually quite different concepts. Remember, in supply and demand we do not cut through candles when identifying zones, unlike support and resistance where traders must look left, through the candles to identify areas of confluence.

With the swap/flip concept we are not cutting through candles. We merely recognize a zone be it supply or demand that was removed. We then look to the right (not left like in support and resistance trading), to see if a zone was left behind as the original zone was being removed.
It is a little bit of an advanced concept but easily seen once the trader's eyes are trained to see them.

I hope that helps

best wishes
Be careful what you think because your thoughts run your life..Solomon
 
 
  • Post #670
  • Quote
  • Jun 15, 2016 8:11am Jun 15, 2016 8:11am
  •  Lade
  • | Joined May 2016 | Status: Member | 43 Posts
Your swift response and manner of replying to question is highly commendable AKT.
please, i heard a trading terminology today and i will like you to assist me or anybody in the house.
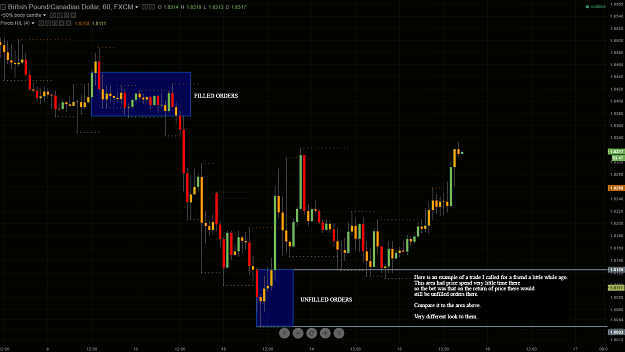
What is the different between FILL ORDER & UNFILLED ORDER?
How can i identify it on a chart? is it going to be one of my decision MATRIX? or it has nothing to do with S & D methodology?

Thank you.
 
 
  • Post #671
  • Quote
  • Jun 15, 2016 9:56am Jun 15, 2016 9:56am
  •  Akt
  • | Commercial Member | Joined Jan 2016 | 2,625 Posts
Quoting Lade
Disliked
Your swift response and manner of replying to question is highly commendable AKT. please, i heard a trading terminology today and i will like you to assist me or anybody in the house. What is the different between FILL ORDER & UNFILLED ORDER? How can i identify it on a chart? is it going to be one of my decision MATRIX? or it has nothing to do with S & D methodology? Thank you.
Ignored
Hello Lade. Thanks for the question.

The concept of filled vs unfilled orders is ingrained in the S.A.D methodology.

What we are doing in identifying zones is identifying unfilled stacks of orders on a price chart. The candles you see on the charts can only be printed after a transaction has occurred, i.e an order has been filled. That is irrelevant information to a S.A.D trader. What we look for are areas or zones where there are likely to be orders left over, unfilled, on the price chart.
It can be a part of your decision matrix if you have a rule for example that you will only trade the biggest stacks of unfilled orders which by definition can and will only be found at extremes of moves.

I hope that helps

best wishes
Be careful what you think because your thoughts run your life..Solomon
 
 
  • Post #672
  • Quote
  • Jun 15, 2016 11:37am Jun 15, 2016 11:37am
  •  Lade
  • | Joined May 2016 | Status: Member | 43 Posts
Quoting Akt
Disliked
{quote} Hello Lade. Thanks for the question. The concept of filled vs unfilled orders is ingrained in the S.A.D methodology. What we are doing in identifying zones is identifying unfilled stacks of orders on a price chart. The candles you see on the charts can only be printed after a transaction has occurred, i.e an order has been filled. That is irrelevant information to a S.A.D trader. What we look for are areas or zones where there are likely to be orders left over, unfilled, on the price chart. It can be a part of your decision matrix if you...
Ignored
Thank you AKT.

If you will not say am bordering too much, i will appreciate if you can buttress the above analogy with a chart for more clarity and understanding.
Thanks.
 
 
  • Post #673
  • Quote
  • Jun 15, 2016 11:53am Jun 15, 2016 11:53am
  •  goathed1
  • | Joined Apr 2012 | Status: Member | 51 Posts
If I'm not mistaken I believe wicky levels where price spends more time there have more filled orders and fresh levels with good departure that spend little to no time there have unfilled orders. Does that sound about right.
 
 
  • Post #674
  • Quote
  • Jun 15, 2016 12:07pm Jun 15, 2016 12:07pm
  •  Akt
  • | Commercial Member | Joined Jan 2016 | 2,625 Posts
Quoting goathed1
Disliked
If I'm not mistaken I believe wicky levels where price spends more time there have more filled orders and fresh levels with good departure that spend little to no time there have unfilled orders. Does that sound about right.
Ignored
Hello goathed.

Correct.

@Lade, here is an example.

Attached Image (click to enlarge)
Click to Enlarge

Name: FILLED_VS_UNFILLED_ORDERS.png
Size: 90 KB
Be careful what you think because your thoughts run your life..Solomon
 
1
  • Post #675
  • Quote
  • Jun 15, 2016 1:57pm Jun 15, 2016 1:57pm
  •  autaret
  • | Joined Aug 2007 | Status: Member | 182 Posts
Quoting Akt
Disliked
{quote} Hello autaret. Welcome back. Been a little while. The way to treat gaps in any market using the methodology is exactly the same. We look for them and treat them as the biggest representations of the imbalances we like to trade. Where a gap is located as always, is paramount. Remember to always do the top down and not just taking a trade because of a gap. (I know you know that already). Here is a random stock I picked when i saw your question. No prior analysis, just looking at the gaps to answer your question pictorially best wishes{image}...
Ignored
OK, thanks. Thinking in terms of imbalances it's always the best thing!
I will send my index analysys soon, we are approciating important weekly DZ.
See you
 
 
  • Post #676
  • Quote
  • Jun 15, 2016 3:36pm Jun 15, 2016 3:36pm
  •  Akt
  • | Commercial Member | Joined Jan 2016 | 2,625 Posts
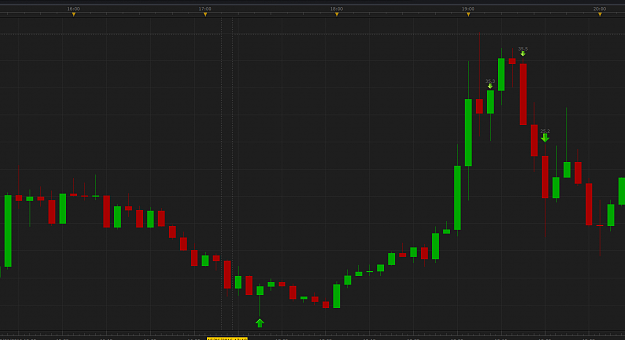
Hello everyone

Aussie FOMC trade. Some of the mentoring guys took this with me.
Remember, not a brag, just showing what is possible for a simple retail trader like me

best wishes
Attached Image (click to enlarge)
Click to Enlarge

Name: AUSSIE FOMC TRADE.PNG
Size: 57 KB
Be careful what you think because your thoughts run your life..Solomon
 
 
  • Post #677
  • Quote
  • Jun 16, 2016 3:24am Jun 16, 2016 3:24am
  •  autaret
  • | Joined Aug 2007 | Status: Member | 182 Posts
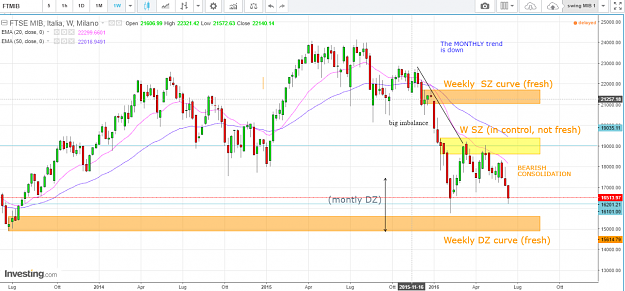
Here is the index i'm following. I show you the weekly chart, it is my "curve" talking in terms of SD metodology. The daily trend chart is clearly in downtrend, the entry 2 hours chart entered a consolidation mode since yesterday. I'm patiently waiting an occasion to enter long.
Am I correct in this chart? The weekly fresh DZ is also inside a montly DZ.
Attached Image (click to enlarge)
Click to Enlarge

Name: 2016-06-16 08_59_33-FTSE MIB Grafici - Investing.com.png
Size: 120 KB
 
 
  • Post #678
  • Quote
  • Jun 16, 2016 3:27am Jun 16, 2016 3:27am
  •  autaret
  • | Joined Aug 2007 | Status: Member | 182 Posts
I'm short from about the middle of the range, took already 50% profit and targetting now the proximal W level fro the rest of the position.
 
 
  • Post #679
  • Quote
  • Jun 16, 2016 3:37am Jun 16, 2016 3:37am
  •  autaret
  • | Joined Aug 2007 | Status: Member | 182 Posts
A monthly DZ stopped by now the downtrend as showed in the chart. That's all
 
 
  • Post #680
  • Quote
  • Jun 16, 2016 6:28am Jun 16, 2016 6:28am
  •  Akt
  • | Commercial Member | Joined Jan 2016 | 2,625 Posts
Quoting autaret
Disliked
Here is the index i'm following. I show you the weekly chart, it is my "curve" talking in terms of SD metodology. The daily trend chart is clearly in downtrend, the entry 2 hours chart entered a consolidation mode since yesterday. I'm patiently waiting an occasion to enter long. Am I correct in this chart? The weekly fresh DZ is also inside a montly DZ. {image}
Ignored
Hello autaret.

This is all fine apart from the down trend line that needs updating.
Remember to always join the 2 most recent peaks for a down trend.
Also, about your targets. Please consider exiting just before the opposing zone to avoid getting involved in the competition to buy that is likely to already be starting the closer we get to demand.

well done sir

best wishes
Be careful what you think because your thoughts run your life..Solomon
 
 
  • Commercial Content
  • /
  • Trading Institutional Order Flow
  • Reply to Thread
    • 1 3233Page 343536 498
    • 1 Page 34 498
1 trader viewing now
  • More
Top of Page
  • Facebook
  • Twitter
About FF
  • Mission
  • Products
  • User Guide
  • Media Kit
  • Blog
  • Contact
FF Products
  • Forums
  • Trades
  • Calendar
  • News
  • Market
  • Brokers
  • Trade Explorer
FF Website
  • Homepage
  • Search
  • Members
  • Report a Bug
Follow FF
  • Facebook
  • Twitter

FF Sister Sites:

  • Metals Mine
  • Energy EXCH
  • Crypto Craft

Forex Factory® is a brand of Fair Economy, Inc.

Terms of Service / ©2022