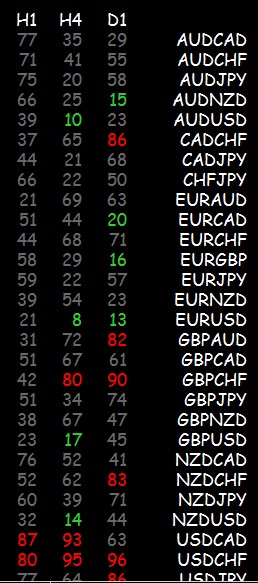
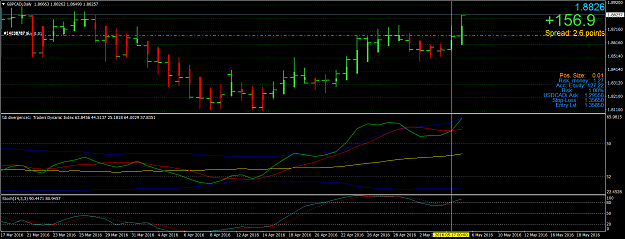
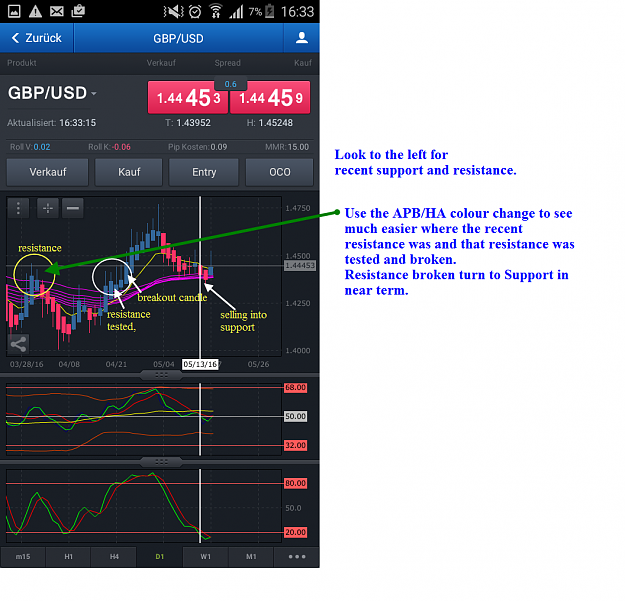
Disliked{quote} Hello mehdi, can you please tell me What went wrong with this trade on GBP/USD on D1 chart. I started a sell trade at the start of the second Red Heiken Ashi candle. The candle size looked good and there was a good TDI cross with good angle under the Yellow line. The stochastic was under 20.I hope you can help me. {image}Ignored
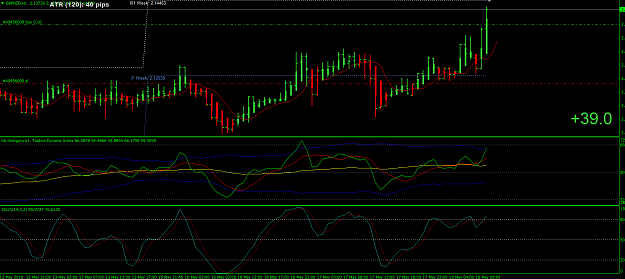
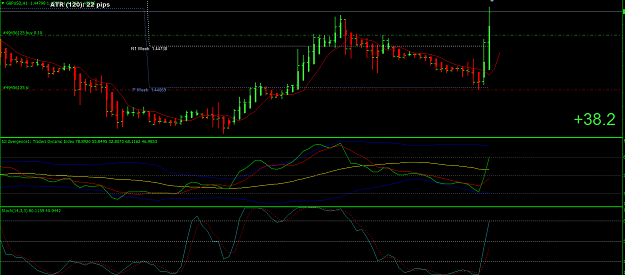
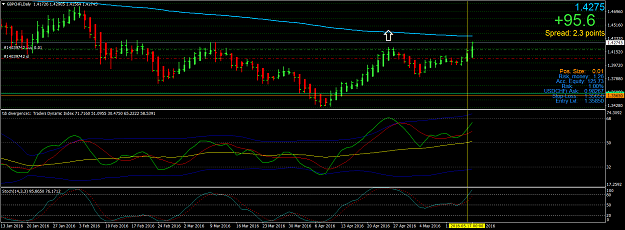
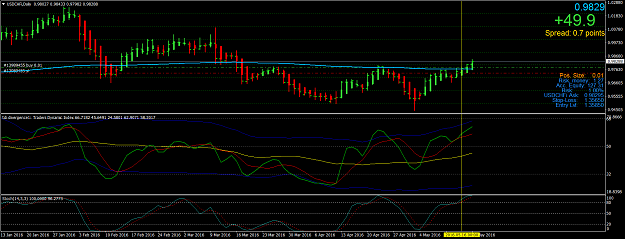
No matter what the Stochastics and TDI are showing on our charts, let the PASR be our 'leading indicator' when we trade with TMS 5-Method.
Also pay attention to price at at the BRN and RN. These BRN and RN attracts buyers and sellers.
Attached Image (click to enlarge)
PASR= Price Action at Support & Resistance
BRN = Big Round Number e.g. 1.4400, 1.4300,...
RN = Round Number e.g. 1.4450, 1.4350,...
Honesty is a very expensive gift. You wont find it in cheap people.WBuffett