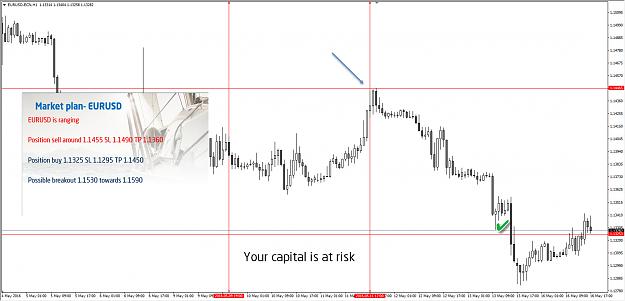
Your capital is at risk
EURUSD bear flag promises vivid trading day
EUR/USD
4 hour https://fxmedia.s3.amazonaws.com/art...05-2016eu4.png
The EUR/USD broke below the long-term support trend line (green), which could be explained via a continuation of wave C (blue) or alternatively a wave 3 if price expands below the 161.8% Fibonacci target.
1 hour https://fxmedia.s3.amazonaws.com/art...05-2016eu1.png
The EUR/USD is building a bear flag chart pattern (purple).A break below the flag could see price head towards the Fibonacci targets. A break above resistance could see price invalidate wave 4 (orange).
GBP/USD
4 hour https://fxmedia.s3.amazonaws.com/art...05-2016gu4.png
The GBP/USD rally has shown strong bullish momentum, which makes it unlikely that price is in a bearish wave C (pink). The wave B (pink) has therefore been put back on the chart and the Fibonacci levels are potential resistance levels.
1 hour https://fxmedia.s3.amazonaws.com/art...05-2016gu1.png
The GBP/USD was unable to break below the 127.2% Fibonacci level of X vs W. The break above resistance (orange dotted) trend line has seen price rally quickly. Now price is near resistance again and the Fibonacci levels are areas where price could struggle or turn.
USD/JPY
4 hour https://fxmedia.s3.amazonaws.com/art...05-2016uj4.png
A potential USD/JPY break above the 161.8% Fibonacci target favors a wave 3 (purple) whereas a bearish break below the support trend line (blue) makes a wave C (pink) more likely.
1 hour https://fxmedia.s3.amazonaws.com/art...05-2016uj1.png
The USD/JPY is moving sideways between support (blue) and resistance (orange). The indecision zone is marked by these trend lines and has become quite large in the meantime. A breakout with a strong 4 hour candle close is therefore preferred to avoid false breakouts. This means a bearish candle with a close near the low and a bullish candle with a close near the high.
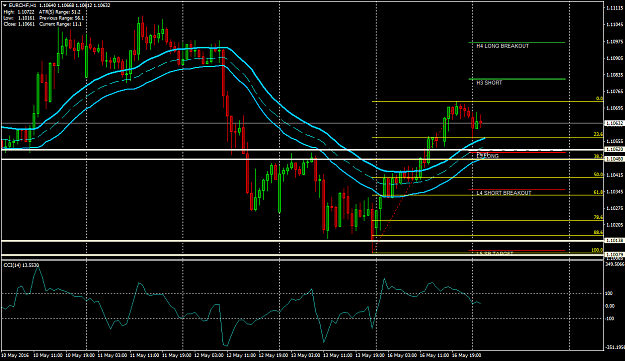
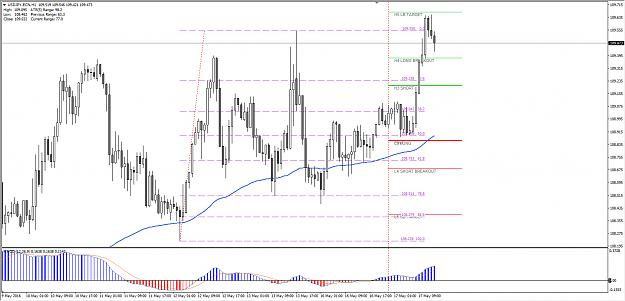
The USDJPY pair has been consolidating in the uptrend that started from 106.50. At this point the price is ranging (also confirmed by MACD) but the bullish momentum is building up. POC is within 108.60-75 zone ( ascending trend line, inner trend line break, 61.8, EMA 89, DPP, H3 ). The zone is showing a lot of confluence and the bullish momentum could spike the price up to 109.20 and 109.65 subsequently. Additionally we can spot now moment buyers (blue rectangle) who have shown exactly at the POC. Have in mind that volatility has faded today due...
Equities is ranging,and most indices are on strong support, if they drop again then JPY pairs could drop a lot (more JPY strength). SP500 below 2040 is very bearish and DAX below 9800 is very bearish too. Additionally - RBA is signalling more rate cuts. Once this happens money will go back into JPY and we will see a stronger JPY again. Also it is very important to keep an eye for FOMC meeting today.
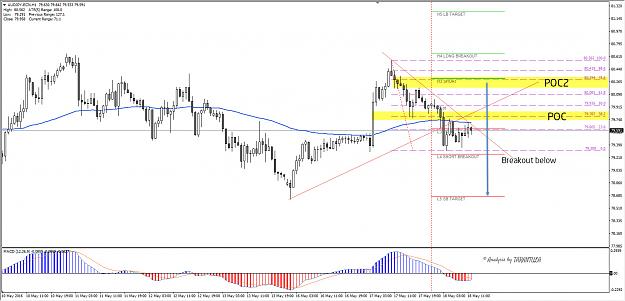
Technically POC is 79.70-80 (L3,38.2,EMA89,trend line cross) and the pair could reject towards 79.25. But if the retracement is going to be deeper, then next POC is 80.15-30 (78.6, H3, historical sellers). targets are 79.25 and only on a strong H1 momentum break or close below the level we could see 78.70.
Equities is ranging,and most indices are on strong support, if they drop again then JPY pairs could drop a lot (more JPY strength). SP500 below 2040 is very bearish and DAX below 9800 is very bearish too. Additionally - RBA is signalling more rate cuts. Once this happens money will go back into JPY and we will see a stronger JPY again. Also it is very important to keep an eye for FOMC meeting today. Technically POC is 79.70-80 (L3,38.2,EMA89,trend line cross) and the pair could...
Ignored
Are you bearish or bullish on DAX then for the next week or so. We have G7 meeting starting this Friday.
Your capital is at risk EURUSD bear flag promises vivid trading day EUR/USD 4 hour {image} The EUR/USD broke below the long-term support trend line (green), which could be explained via a continuation of wave C (blue) or alternatively a wave 3 if price expands below the 161.8% Fibonacci target. 1 hour {image} The EUR/USD is building a bear flag chart pattern (purple).A break below the flag could see price head towards the Fibonacci targets. A break above resistance could see price invalidate wave 4 (orange). GBP/USD 4 hour {image} The GBP/USD rally...
UJ broke yesterday to the upside and is contuining today. It's making a bullish breakout and we should expect further upside. Be careful of the FOMC later today at 6pm GMT, this can generate volatility and spikes.
{quote} UJ broke yesterday to the upside and is contuining today. It's making a bullish breakout and we should expect further upside. Be careful of the FOMC later today at 6pm GMT, this can generate volatility and spikes.
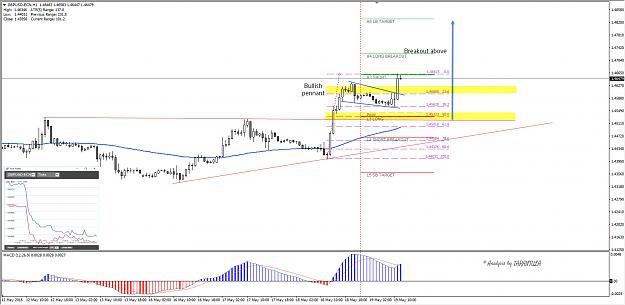
Fears of Brexit have diminished at least for the time being as latest polls suggest that pro EU option leads by 10 % (55 % vs 45 %). Additionally very good data for Average Earnings Index and Claimant Count Change has spurred additional bullish momentum where the GBPUSD reached 1.4660 resistance.
Technically we can see rising MACD, and confluence within first POC that is 1.4600 zone (pennant breakout , 23.6, round number ) and traders should watch for a possible bounce at the zone.
POC2 is 1.4520-35 zone where we see a confluence - DPP, L3, 50. Below is a strong support 1.4500 with 61.8 and EMA89. If we see another rejection targets should be 1.4660 and only on 1h momentum break or 4h candle close above H4 cam pivot - 1.4725 we could see 1.4830.
1.4500 should stay firm else the pair is back in a range with a downtrend potential.