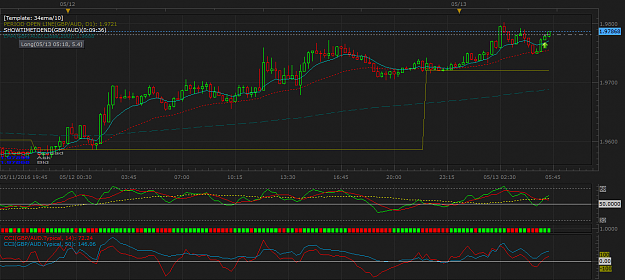
Please pardon my newbie-ness. What is the yellow line running through the TDI and how do I get it? The TDI RED GREEN gives me just that: one red line and one green line. Any assistance is appreciated.
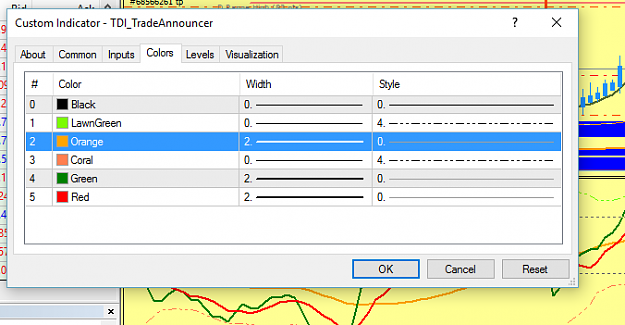
Thanks for the video, mizi123. The explanation of what the lines are is great. However, that does not tell me how to get the yellow line on my charts. There's not a "Overall Market Sentiment" indicator on the indicator list that I can pull over onto my charts. What is the line called in the indicator list, or is the yellow line created by changing the property settings in the TDI? If so which ones do I change? There are 6 lines that could be changed. 0, 1, 2, 3, 4, and 5. Default--0=black, 1=none, 2=none, 3=none, 4=green, 5=red.
Thanks for the video, mizi123. The explanation of what the lines are is great. However, that does not tell me how to get the yellow line on my charts. There's not a "Overall Market Sentiment" indicator on the indicator list that I can pull over onto my charts. What is the line called in the indicator list, or is the yellow line created by changing the property settings in the TDI? If so which ones do I change? There are 6 lines that could be changed. 0, 1, 2, 3, 4, and 5. Default--0=black, 1=none, 2=none, 3=none, 4=green, 5=red.
Ignored
Go to indicator and settings need to stay as they are just go to colors and put the color on as you see in picture and OK thats it
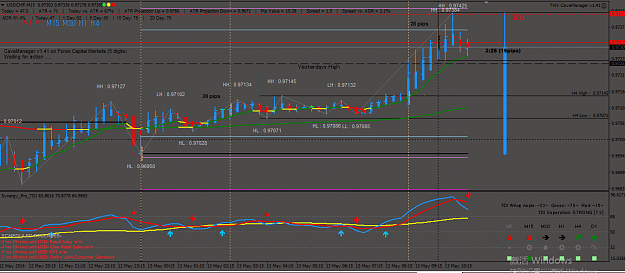
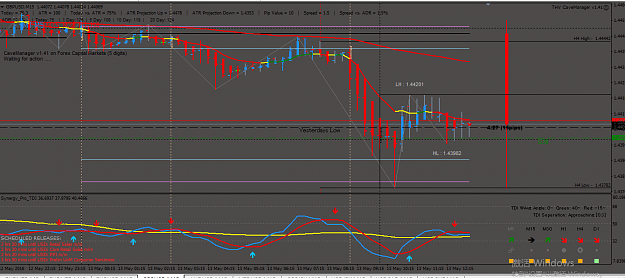
one quick question, does wide range bar affect this system?
Ignored
it depends on the condition... large candle mean there is strong buyer/seller in that direction. you have to consider the overall picture. if you have the confident the price will go in the way. why not enter?
i think this scenario just happened a while ago across USD pairs and JPY pairs. you cannot win it all. just dont take trade when you are not confident
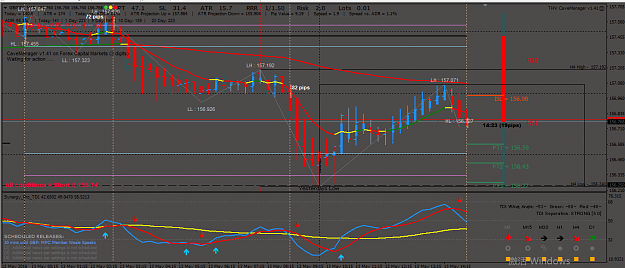
yeah, stopped out to the pip..I just tried a small stop and got kicked out...that's why I always put my stop at previous swing which was not the case and so got stopped out. Took 20 pips loss earlier with e/y..2 losers and 34 pips loss
{quote} it depends on the condition... large candle mean there is strong buyer/seller in that direction. you have to consider the overall picture. if you have the confident the price will go in the way. why not enter? i think this scenario just happened a while ago across USD pairs and JPY pairs. you cannot win it all. just dont take trade when you are not confident
Ignored
Thanks mate. you are using 15min TF method or 4 hrs? i didn't find the rest 2 more methods of loveevery1 over here. can you help me out?
Hi There,,, Ive been locked into reading threads here and on Bpips for about a mnth now ,,, its driving me nuts reading about all these indicators and eas in the hope that one is going to make me $s. So here I am ive subscribed to this thread last week as it seems to have regular following and from what I can gather is more of a Strategy that I can learn and trade with,,,, So, with help from this thread i'm going to give it a go ,,, I read that things hasn't changed much from the first few pages ? ,,, good I don't have to read 1420 messages? Just had a look at video at top of this page and I do understand the idea. Is this an Indicator that I can download here somewhere ?
Looking forward too some Positive learning and some Positive Pips