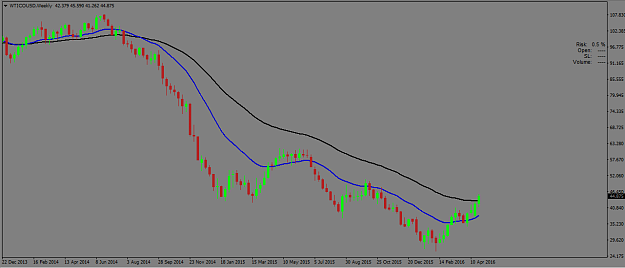
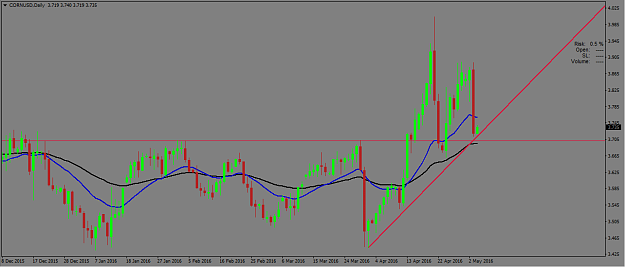
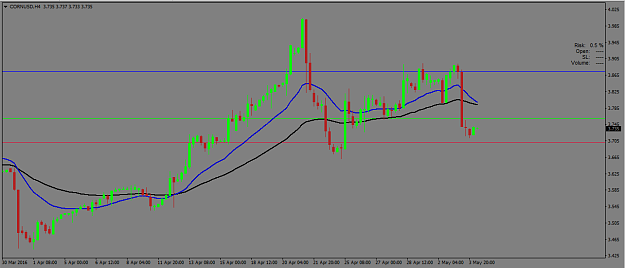
My thoughts on support and resistance, since I may seem inconsistent on the subject. If I am trading a commodity - eg copper, wheat, platinum etc ..... I take great notice of horizontal support/resistance levels and big round numbers such as 1.500 and 2.2500. Commodities are actively traded into these levels and price respects them. I often use these levels to place S/L and T/P targets.
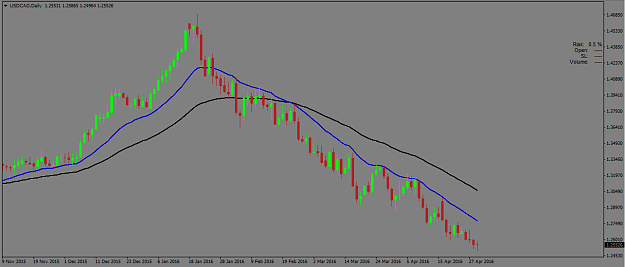
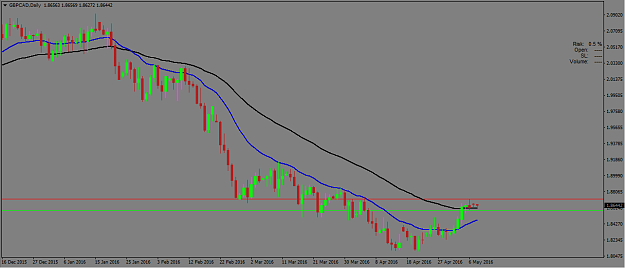
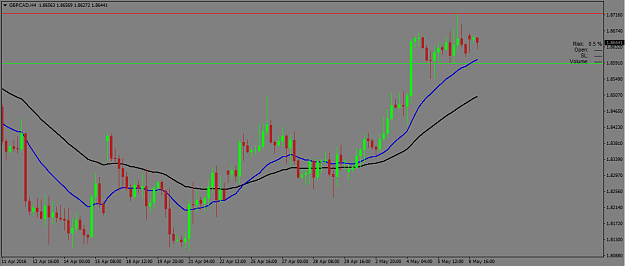
If I am trading a major currency pair, such as EUR/USD or USD/CAD I take a little notice of these levels, but I consider the trendlines and moving averages more important. Sometimes I will avoid a trade if I will be buying into heavy resistance/selling into heavy support or a big round number just to be safe.
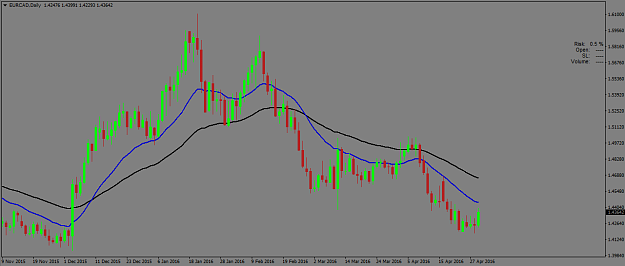
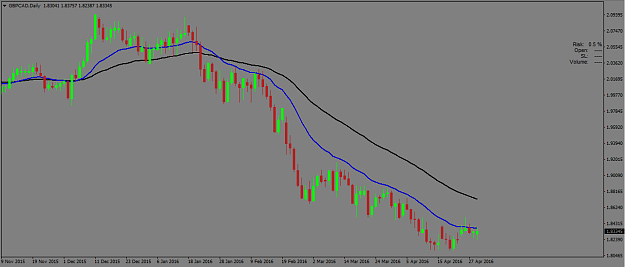
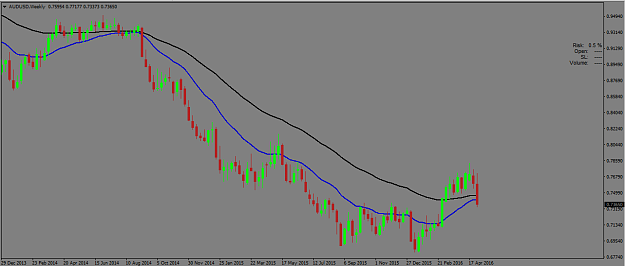
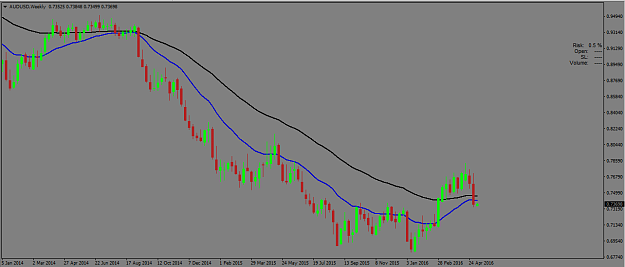
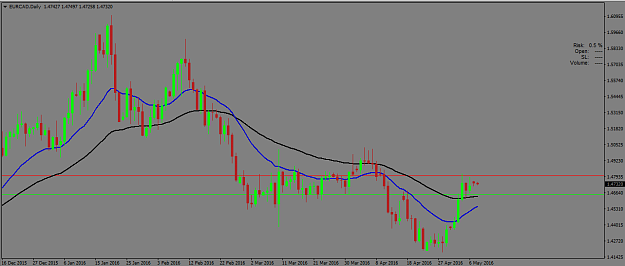
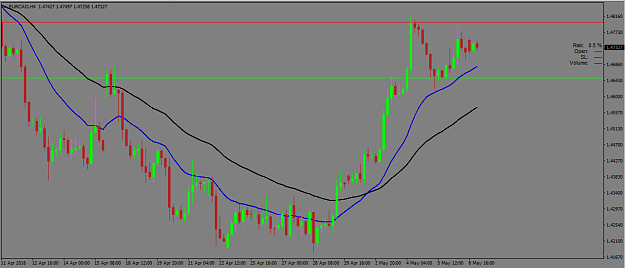
If I am trading a currency cross such as AUD/CAD, I don't take any notice whatsoever of horizontal S/R levels or big round numbers, I consider them to be logically irrelevant. If the Australian Dollar is increasing in value it is hitting resistance levels against every other currency - eur, gbp, nzd, usd etc.... it isn't going to stop and turn around just because it hit some level against the CAD. And the Canadian Dollar isn't going to change direction because it hit a horizontal level against the AUD. When trading the crosses I like to use trend channels to identify exit targets, or even use time exits (getting out at the end of the week, or after xxx number of days).
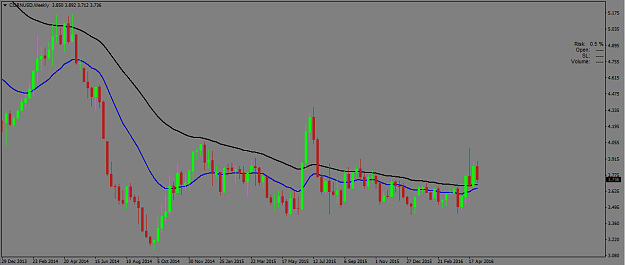
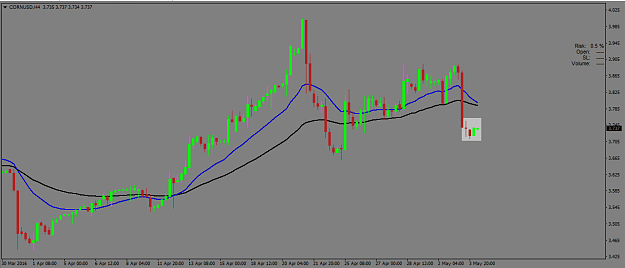
This is where my method gets a little complex .... I don't treat every asset the same, I think each instrument is driven by, and responds to different things and they need to be treated slightly differently. A method that works for EUR/USD wont necessarily work for Soybeans. The basics of my entry method don't change ..... find a trend on the weekly chart, wait for a pullback on the daily then enter when 4H turns back to the weekly trend. That's the only way I enter a trade, but I use slightly different analysis methods for different assets.
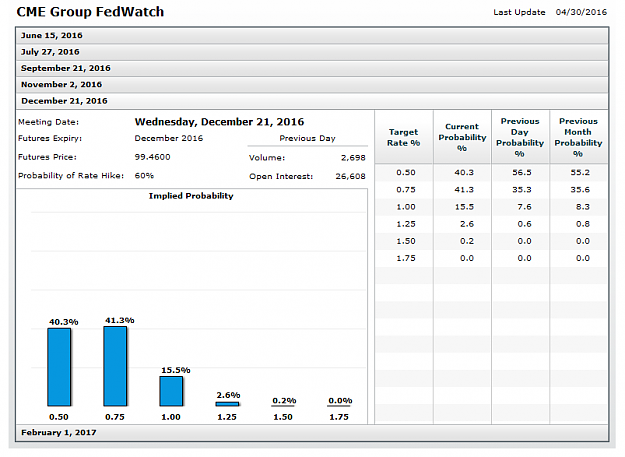
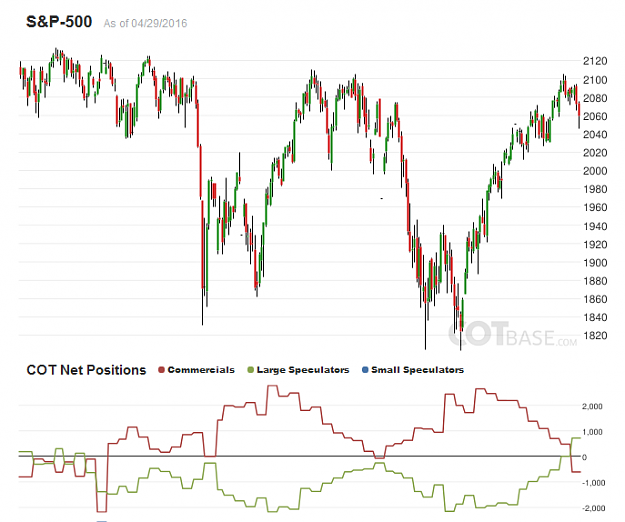
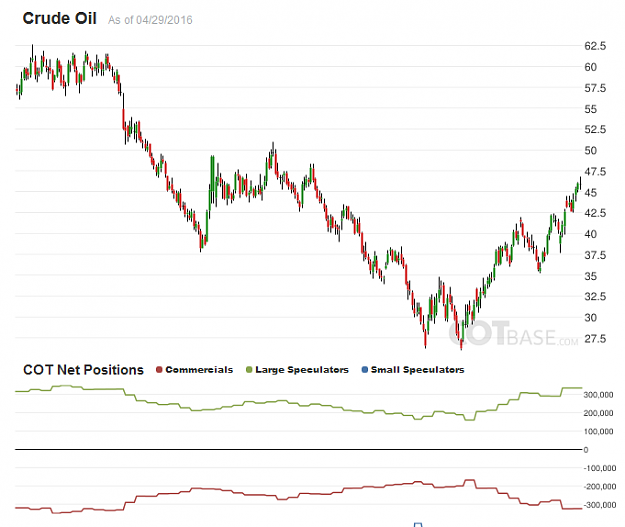
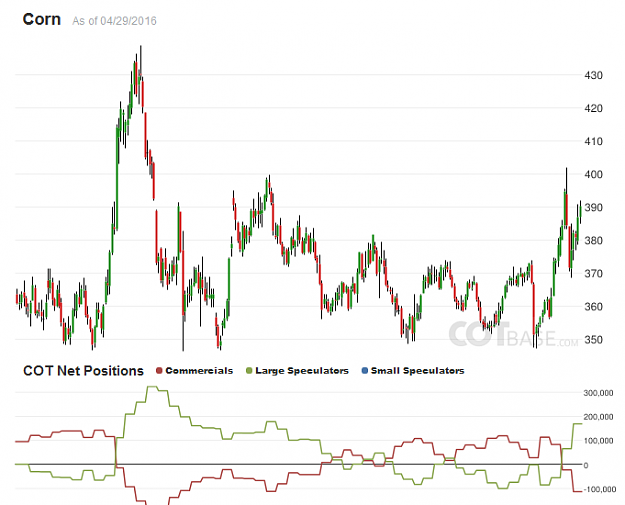
I also only use COT data for commodities, I never use COT on currencies. If you look at the raw COT data from the CFTC website it tells you how many traders report each week .... this week the COT data on the Swiss Franc only shows the net positioning of 43 traders. On the NZ Dollar it's only 68 traders. That's a low sample size, 43 traders is a small drop in a large ocean and doesn't have any real bearing on the future direction of the currency.
This weeks corn COT data on the other hand is drawn from 729 traders. The Corn market is much, much smaller than the NZD market and those 729 traders are f*ing big players, so that is significant. Those 729 traders most likely buy and sell enough corn to move the market significantly, so that is why I take notice of COT positioning in commodities but not currencies.
If I am trading a major currency pair, such as EUR/USD or USD/CAD I take a little notice of these levels, but I consider the trendlines and moving averages more important. Sometimes I will avoid a trade if I will be buying into heavy resistance/selling into heavy support or a big round number just to be safe.
If I am trading a currency cross such as AUD/CAD, I don't take any notice whatsoever of horizontal S/R levels or big round numbers, I consider them to be logically irrelevant. If the Australian Dollar is increasing in value it is hitting resistance levels against every other currency - eur, gbp, nzd, usd etc.... it isn't going to stop and turn around just because it hit some level against the CAD. And the Canadian Dollar isn't going to change direction because it hit a horizontal level against the AUD. When trading the crosses I like to use trend channels to identify exit targets, or even use time exits (getting out at the end of the week, or after xxx number of days).
This is where my method gets a little complex .... I don't treat every asset the same, I think each instrument is driven by, and responds to different things and they need to be treated slightly differently. A method that works for EUR/USD wont necessarily work for Soybeans. The basics of my entry method don't change ..... find a trend on the weekly chart, wait for a pullback on the daily then enter when 4H turns back to the weekly trend. That's the only way I enter a trade, but I use slightly different analysis methods for different assets.
I also only use COT data for commodities, I never use COT on currencies. If you look at the raw COT data from the CFTC website it tells you how many traders report each week .... this week the COT data on the Swiss Franc only shows the net positioning of 43 traders. On the NZ Dollar it's only 68 traders. That's a low sample size, 43 traders is a small drop in a large ocean and doesn't have any real bearing on the future direction of the currency.
This weeks corn COT data on the other hand is drawn from 729 traders. The Corn market is much, much smaller than the NZD market and those 729 traders are f*ing big players, so that is significant. Those 729 traders most likely buy and sell enough corn to move the market significantly, so that is why I take notice of COT positioning in commodities but not currencies.
si hoc legere scis nimium eruditionis habes
3