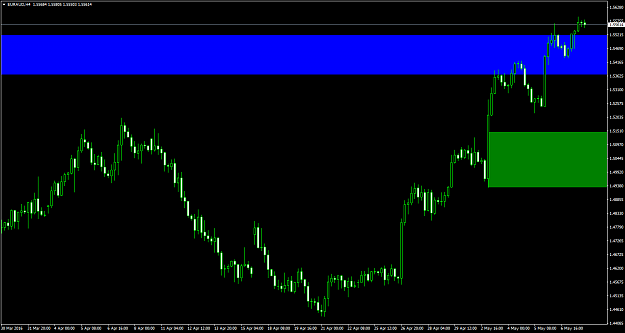
EURAUD
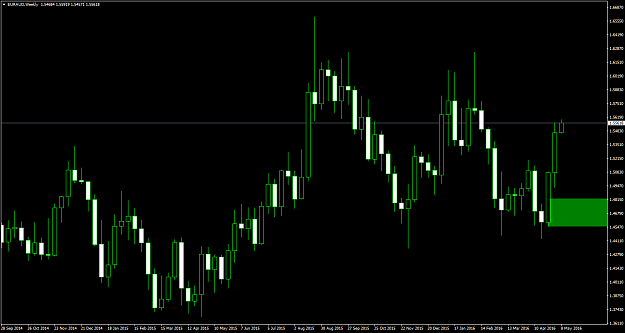
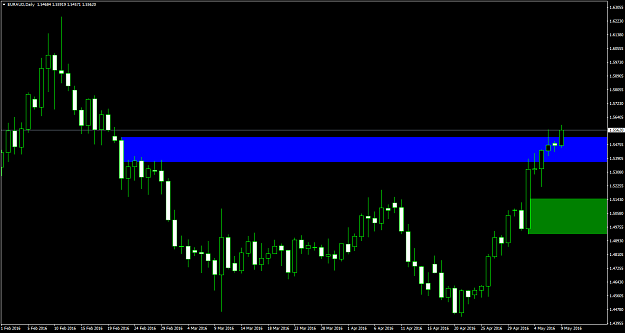
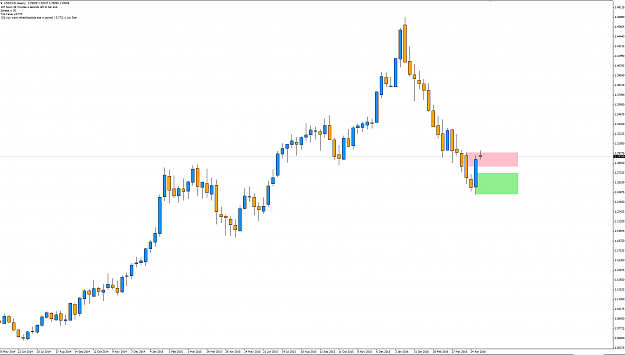
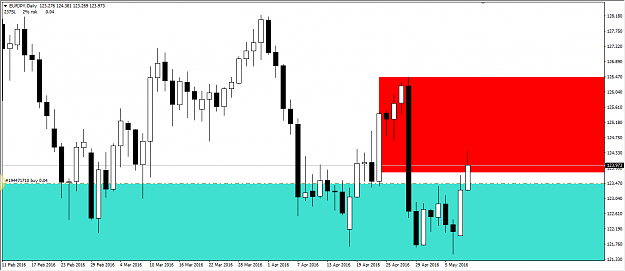
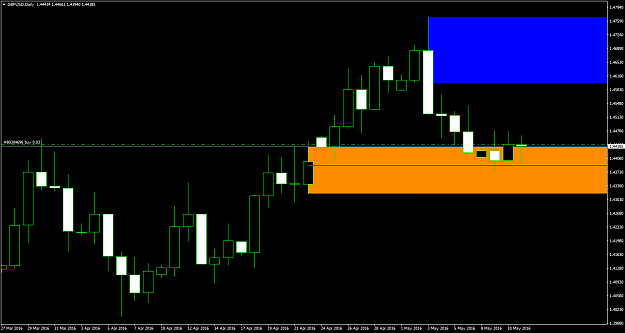
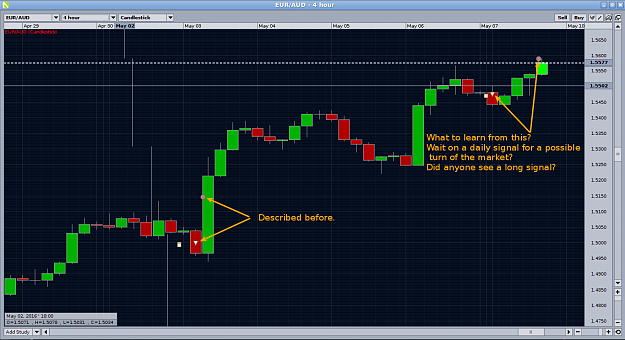
This one is not my favorite pair. Again a loser. I was so tempted to short this one. Maybe because of the 'shooting star' daily candle (060516), although it close bullish. Now I think it is too small in regard to the up move which preceded it. Anyway I adjusted position size as I did not 'trust' it to be a good trade. Maybe I should add a new rule: When in doubt stay out!
This one is not my favorite pair. Again a loser. I was so tempted to short this one. Maybe because of the 'shooting star' daily candle (060516), although it close bullish. Now I think it is too small in regard to the up move which preceded it. Anyway I adjusted position size as I did not 'trust' it to be a good trade. Maybe I should add a new rule: When in doubt stay out!
Attached Image (click to enlarge)
Posting Demo charts, mirroring some of them live.