{quote} ...the impulse to take the least logical approach.
Ignored
Not so sure that counter-trend trading is illogical, if done with method to it, i.e. clearly defined and back-tested setups. Some of the best traders around are C-T traders...
{quote} Not so sure that counter-trend trading is illogical, if done with method to it, i.e. clearly defined and back-tested setups. Some of the best traders around are C-T traders...
Ignored
Again, we will have to revert back to the subject under discussion, which is how to identify a trend and how should we trade it. Of course, counter trending can be profitable, but it is more difficult and most inexperienced traders will end up losing if they try to do it unless they have a tried and tested method. Better to concentrate on going with momentum following pullbacks, and then as one's knowledge, experience and feel for the market improves over time, begin to pick off those nice counter-trend moves So no, it is definitely not illogical, but the way many people trade certainly is, and I am only referencing back to many of the awful trades I have made in the past and still make, though less than I did a few years ago!
One of the main problems with trend trading is how and when to take profits. Trend Entropy Often you'll fine a trend starts out nice and smooth and continues nice and smooth for some time but then as the trend ages (not necessarily over) it starts to get wilder with the moves less classic and far more volatility, that's trend entropy and you need to trade (or manage) a position differently than if positioned towards the start of the trend.
Ignored
by which time I would say it would have been wise to have already exited one's position. This volatility usually happens when the ratio of buyers and sellers has evened out, so what's left is traders still say short, but fewer than there were, and traders who are now going long. After much huffing and puffing, one side will crack depending on the technical set up. You can see this very well demonstrated on one of the charts I posted on Sunday, a few pages back now, extreme volatility at the end of a strong down move, where anyone with poor timing would have been cut to pieces, before the price finally breaks north.
The big secret is in your hard work . I think forex trader get this secret after a long time spend in trading. He knows different times of trading that are suitable , indicators that help him is successful trading. Each and every tip of trading waiting for trader when he got it with his skill .
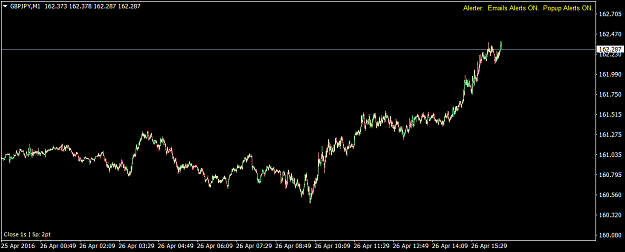
{quote} Good stuff. GJ's M1 trading today. At what point would you have considered the "trend" had established and it was safe to buy? {image}
Ignored
hi simond,
The value changes would have enabled a perfect entry on cable at 1328 or 13 29 uk time.the price was 14564,the overall market at that point had established agreement and synce.
.The early part of the gbp/gpy move which began london open would have carried greater risk for the first leg up, agreement was not evident until later during the morning.
if you compare the cable chart and the gbp/yen charts it will be clearer,i was watching the values across 14 pairs and through those flows i was able determine firstly market trend as a whole,and secondly a very safe entry level with very limited risk supported by forward evidence of agreement
Trends, Ranges one in the same. Someone earlier wrote that the only difference is in the timeframe.
Price ranges, then it leaves the range. Most of the time when it leaves the range it does it rather quickly and is easily identifiable. Generally price will go from high to low to high to low with each high or low visit having a chance of price moving past that high or low. A range on the weekly will have plenty of 1 way looking price movements on the 4hr as it trades between that weekly high and low. Consecutive breaks in 1 direction will have the effect of looking like what is discussed as a trend. It may very well be a trend but a trend can only be defined after it already has existed. Its just a way of saying "in the end, price went up".
Here's a study people should partake in. Whats the least amount of info needed to define a range? How often does price reverse around the highs and lows of the ranges i've defined?
You may be able to find your trend in that.
{quote} hi simond, The value changes would have enabled a perfect entry on cable at 1328 or 13 29 uk time.the price was 14564,the overall market at that point had established agreement and synce. .The early part of the gbp/gpy move which began london open would have carried greater risk for the first leg up, agreement was not evident until later during the morning. if you compare the cable chart and the gbp/yen charts it will be clearer,i was watching the values across 14 pairs and through those flows i was able determine firstly market trend as...
Ignored
Hey diceman555,
Thanks for dropping by. I checked out the Cable chart. Totally agree.
I'd actually been looking at similar PA GJ, and funnily enough the exact same time M1 candle, but like u say, it's that cable structure today that bears all the hallmarks of the better and very safe entry. Nice one
Trends, Ranges one in the same. Someone earlier wrote that the only difference is in the timeframe. Price ranges, then it leaves the range. Most of the time when it leaves the range it does it rather quickly and is easily identifiable. Generally price will go from high to low to high to low with each high or low visit having a chance of price moving past that high or low. A range on the weekly will have plenty of 1 way looking price movements on the 4hr as it trades between that weekly high and low. Consecutive breaks in 1 direction will have the...
Ignored
If viewed in that way yes ,but all you need is a way of measuring market sentiment as one.a chart is not required to cleary determine present sentiment and any change in that sentiment.if agreement is across market you have plenty of time to see a shift in that sentiment.individually things can change very quickly but as a collective group it requires time to stop and change its weight is far greater and that collective force requires a much reduced rate of slowing down
{quote} If viewed in that way yes ,but all you need is a way of measuring market sentiment as one.a chart is not required to cleary determine present sentiment and any change in that sentiment.if agreement is across market you have plenty of time to see a shift in that sentiment.individually things can change very quickly but as a collective group it requires time to stop and change its weight is far greater and that collective force requires a much reduced rate of slowing down
Ignored
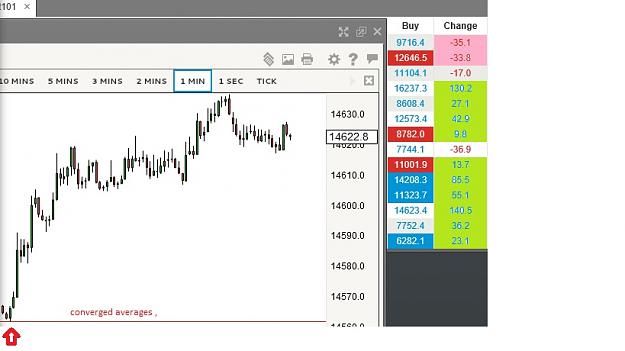
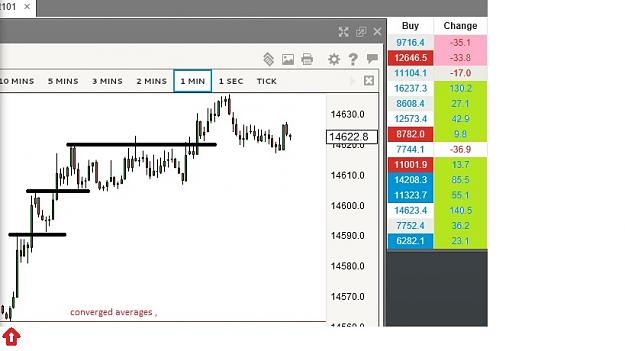
What i suggest isn't a counter to sentiment or any other type of analysis. It's the price movement distilled down as basic as i could while being able to retain an acceptable amount of objectivity. This can be used in tandem with what you suggest.
Lets say you don't have the ability to predict sentiment changes outside of your chart. Or lets say you do have the ability to predict this sentiment change, you may get in to early. How would you know when the right time is?
Attached Image (click to enlarge)
You can see how price pushes through the highs quickly and in an easily identifiable manner. You really don't need much more than this. Some basic ability to understand sentiment, some basic S/R analysis, and a little common sense (ability to learn from mistakes) and you can take what looks like crazy trend trades.
|
Joined Jan 2015
|
Status: On Discipline Road
|933 Posts
1. Knowing when to trade and when not to trade. i.e. when conditions match the strategy you've picked up/developed and when they don't
2. Actually executing everything in real market conditions based on the above knowledge
{quote} What i suggest isn't a counter to sentiment or any other type of analysis. It's the price movement distilled down as basic as i could while being able to retain an acceptable amount of objectivity. This can be used in tandem with what you suggest. Lets say you don't have the ability to predict sentiment changes outside of your chart. Or lets say you do have the ability to predict this sentiment change, you may get in to early. How would you know when the right time is? {image} You can see how price pushes through the highs quickly and in...
Ignored
yep we are on the same page.
im just adding an alterative and forward way of reconising market agreement (trend at this moment)which can be a exellent way of entry enabling very low risk .as you say combined together it becomes a very powerfull tool
{quote} Good stuff. GJ's M1 trading today. At what point would you have considered the "trend" had established and it was safe to buy? {image}
Ignored
My favourite fx pair by miles, can't understand why more people don't trade it. Well, I wasn't trading this today, so I can only offer you what I would have done had I been trading it. First off, for me the uptrend is still in place, and until the 10m 200ema has been broken and retested, this will remain. I would have been watching this time frame, and the 100sma on the 30m, because these are the levels, given the time of the day, which was the London open, that a significant move would have been anticipated. I would have had a long bias because the trend is up. My 30 second chart has a clear ( to me ) signal to buy at 08.06 am, a candle which closed above my signal moving averages on that time frame. Beyond that, there was a pullback towards the 30 sec 200ema which left a very nice looking hammer at 08.29.30 which I would have gone for, and another entry signal at 09.27.30.
For me therefore, on your m1 chart, once the price had broken through the 200ema, and then come back to test it before climbing again, the trend was in place, and you'll see that the 200ema has only been broken for the first time within the last 15 mins. It tested it just after 11am, and again at 12.30, but it never closed beneath it. How would I have known that the price would not break through it at these points? Well, I wouldn't, but, my 30m chart has a bullish continuation ma beneath it at this level, so I would not have sold, and I would not have exited.
I hope this answers your ?, and I apologize if it sounds like cherry picking, but I can only relay what I think I would have done according to the system I use., and where I would have considered buying and staying in the trade.
Trends, Ranges one in the same. Someone earlier wrote that the only difference is in the timeframe. Price ranges, then it leaves the range. Most of the time when it leaves the range it does it rather quickly and is easily identifiable. Generally price will go from high to low to high to low with each high or low visit having a chance of price moving past that high or low. A range on the weekly will have plenty of 1 way looking price movements on the 4hr as it trades between that weekly high and low. Consecutive breaks in 1 direction will have the...
Ignored
As far as I know, there are different ways to determine the direction of movement or to determine (predict) the trend in advance. It may be, for example, oscillators or patterns. Everyone chooses to suit your style. The minimum information in this case - the two points between which can be a trendline. Fluctuations around the top or bottom point depends on how strong the level of effect on the price.
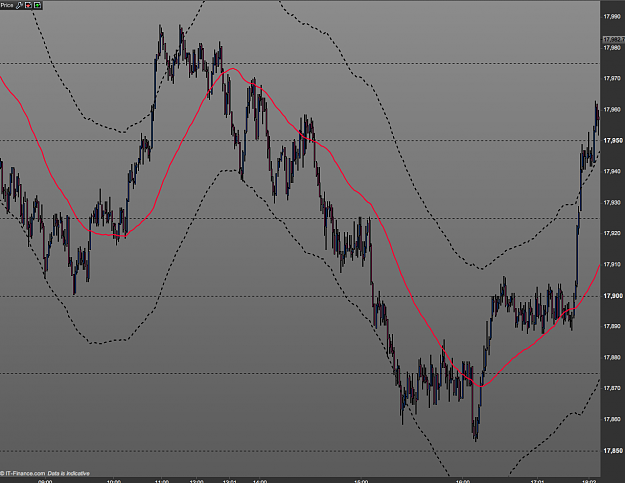
One signal that a trend is coming to an end is diversion, which I know many people know and use, but no harm in mentioning it here. GJ offers a very good example of this on the Daily chart, The great thing about diversion is that it can be anticipated. So draw a line from the low of feb 24th on this pair, connecting it to April 7th. You'll see big diversion with the MACD ribbon, which not only has to be interpreted as a signal that the trend may be over, but it also gives a signal to buy, especially if you get a few candles confirming it as you do here.. This time frame is way too big for me, but it's exactly the sort of pattern I look for on any time frame.
One signal that a trend is coming to an end is diversion, which I know many people know and use, but no harm in mentioning it here. GJ offers a very good example of this on the Daily chart, The great thing about diversion is that it can be anticipated. So draw a line from the low of feb 24th on this pair, connecting it to April 7th. You'll see big diversion with the MACD ribbon, which not only has to be interpreted as a signal that the trend may be over, but it also gives a signal to buy, especially if you get a few candles confirming it as you...
Ignored
well yes and no.. profit taking after extended moves can also create divergence waves that the big money sell/buy into.. Thus having the opposite effect visually
So the continuation is absorbed by profit taking, having a divergent type effect. But divergence is def good if you understand the situation..
Thanks cat, no not cherry picking at all - a bit of post-match analysis is always good.
I decided a while ago to only trading GJ. Was actually trading EURAUD quite a bit as well but once I became a bit more comfortable with the m1 it's self-evident that GJ gives up plenty enough pips.
I rejected the idea of MAs quite early on having had a poor experience with them only ever seeming to buy right at the point that price made a pullback. Having said that I do see that combined with the other stuff learned since then they definitely have their uses.
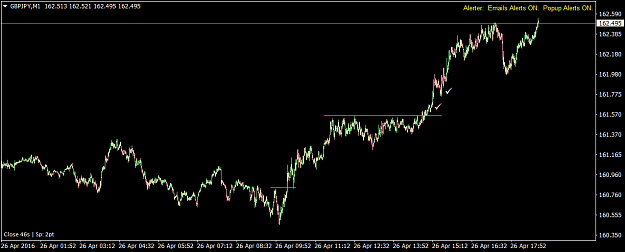
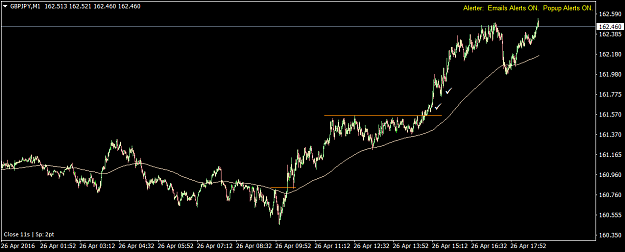
For me today, GJ was a bit tepid. On this chart, the "trend" change comes at that PA around the lower yellow line. There's quite a nice bullish W evident, but price also takes out the highs to the left - always a nice sign. At that point I'd already marked up the M5 chart and was waiting for a decent PA but unfortunately what I usually look for didn't form.
It's actually only around the break of the upper yellow resistance with the PA marked by the two ticks that I would have been interested in buying this pair today.
Two versions of this chart; one without an EMA and with a 200 EMA. I still probably won't trade with MAs, however, it is interesting how price touched mid-session and only recently came back.
{quote}. Two versions of this chart; one without an EMA and with a 200 EMA. I still probably won't trade with MAs, however, it is interesting how price touched mid-session and only recently came back. {image} {image}
Ignored
As they say, If it ain't broke, don't fix it. However, never rule anything out, you may fall in love with MAs yet!
ps...GJ is just beneath its Daily 100sma by the way, 16,336, so watch that!
{quote} As far as I know, there are different ways to determine the direction of movement or to determine (predict) the trend in advance. It may be, for example, oscillators or patterns. Everyone chooses to suit your style. The minimum information in this case - the two points between which can be a trendline. Fluctuations around the top or bottom point depends on how strong the level of effect on the price.
Ignored
True. It just takes some looking to define what strength means to your trading.
Also, oscillators just measure where price is now in comparison to where it was. In effect, its just telling you something that you can just look at a chart to tell. What value that brings depends on what aspect of your market you're trading.
Divergence is the same thing. For example, if price ranges for 3 days breaks the low of the range then moves back into and goes above that range by 100 pips you have one oscillator swing. Now if after that price ranges for 3 days in the same manner and just goes above the range by 100 pips you now have divergence. But now the question is, are we trading something only seen on an oscillator or exhaustion?