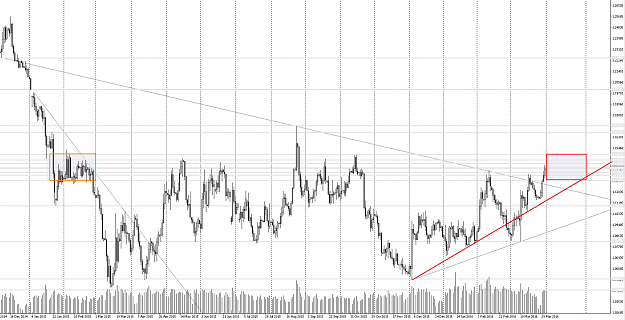
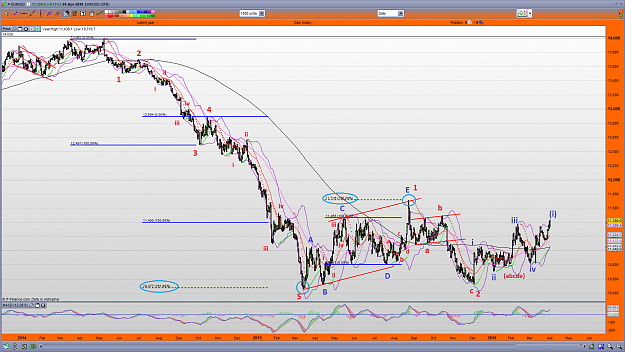
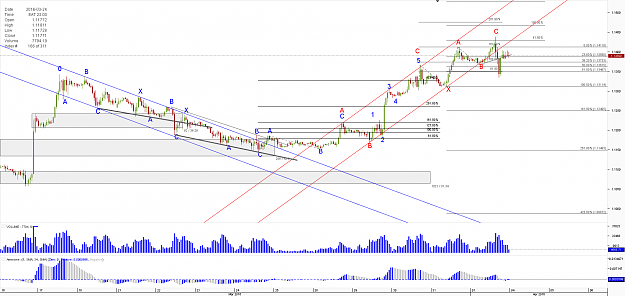
Following is my main count in EU
As I have laid out numerous times, I decided for this count, because the waves blue 1 to 3 down, as well as their subwaves have exceptionally well fib-ratios.
But on the other hand, a count has to have the right look. What is disturbing in this count, is the fact, that the blue wave 2 is so tiny in price and time, and the wave 4, regardless if we deem it as already finished or ongoing, is so much bigger in price and time.
Even when we think, that the wave blue 4 is already finished, it looks a bit strange to me.
Add to this, that the sideways correction (the wave blue 4) might not be over at all. I counted the downward movement from the 1.17 high as red 1,2,3, now in 4. It would be more like a leading diagonal than an ending diagonal, because when we look at the structure of the waves red 1 and 3 they do look pretty impulsive.
The wave red 4 is now at the verge of invalidating this leading diagonal count. Above 1.1495 will not only invalidate the leading diagonal but also my main count at all, because the supposed to be wave blue 4 would transform into a larger sideways structure.
Generally speaking: the chance, that my main count is wrong are getting pretty high.
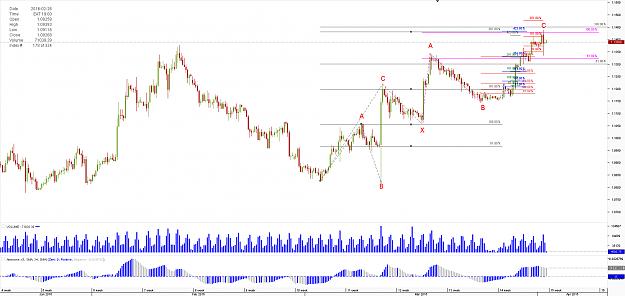
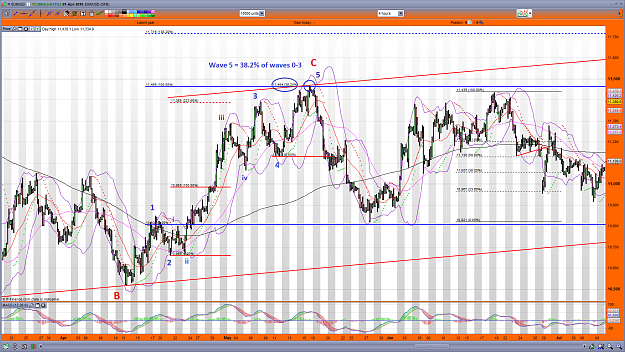
We had discussed earlier, that there is a pretty good chance, that the whole impulse down from the 1.399x high down to the 1.04x low is a finished impulse
One can count it as following:
Since the structure in the pattern since the 1.04x low has now clear impulsive starting pattern, chance is very high, that this all is only a sideways pattern.
Some questioned me, if the move from the 1.04x to the 1.17x high could not be counted as leading diagonal. Yes, it can be counted as leading diagonal, even the following decline was deep enough to justify this assumption.
But: leading diagonals most of the time have clear impulsive structure 5-3-5-3-5. This starting sequence from the low does have a pattern that looks for me like 3-3-3-3-3
Now will be decision time, if price will end the wave C here (then chances for a prolonged sideways movement is very high in form of a contracting triangle), or if we shoot higher (chance would than be high, that all of the overlapping movements since the 1.05 low were multiple 1-2 startsequences. In this case price may easily reach into the 1.2x territory.
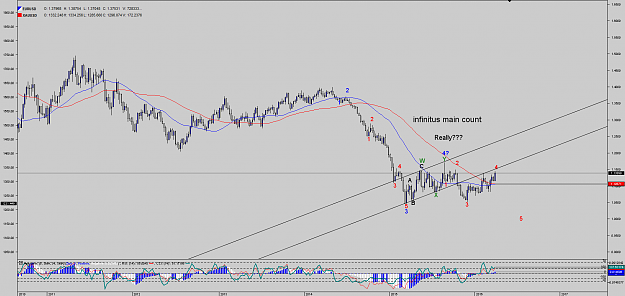
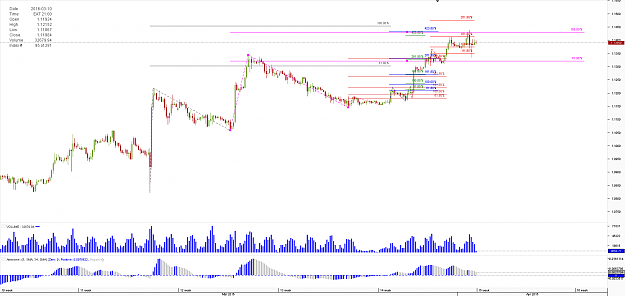
At the moment i lean towards the immediate bearish case. In this case, we can count the movements up since the low on 03.24.2016 as ABC-x-ABC as shown below:
EU 1h TF
Fib confluences in the upmove
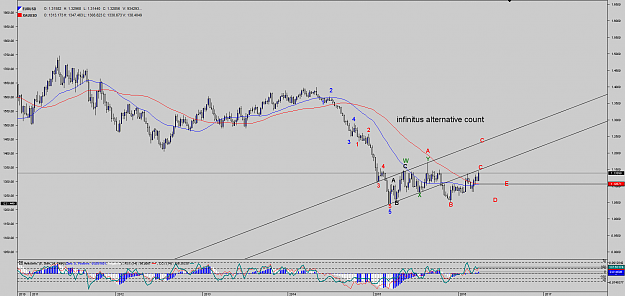
EU 2h TF
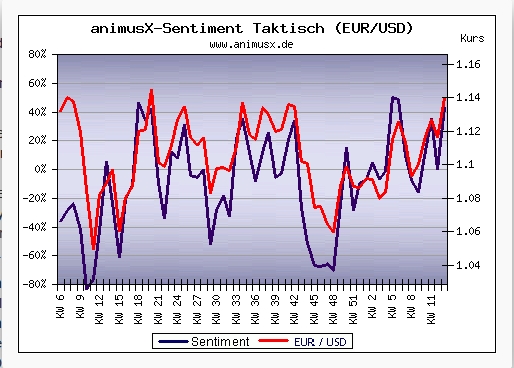
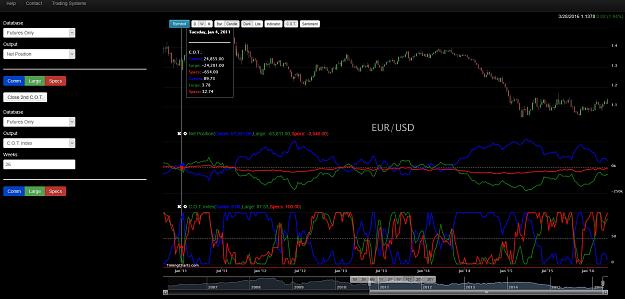
The current Daily Sentiment Index is around 73% bulls.
Retail trader are heavilly short at the moment, but have staggered their huge bullish bets just below of 1.13 according to Oanda and Saxo Bank (showing their longer term bullish mindset).
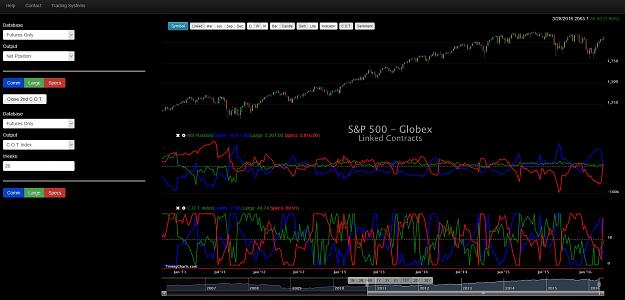
COT data show, that the commercials are further reducing their long positions, whereas the small and large trader are about to go long. Since the data of the COT is, as every time, from Tuesdays, the data is a bit lagging. Maybe we can see next week, that the large traders are net long and the Commercials are net short.
The COT Index is near an ideal position to think about short positions
As I have laid out numerous times, I decided for this count, because the waves blue 1 to 3 down, as well as their subwaves have exceptionally well fib-ratios.
Attached Image (click to enlarge)
But on the other hand, a count has to have the right look. What is disturbing in this count, is the fact, that the blue wave 2 is so tiny in price and time, and the wave 4, regardless if we deem it as already finished or ongoing, is so much bigger in price and time.
Even when we think, that the wave blue 4 is already finished, it looks a bit strange to me.
Add to this, that the sideways correction (the wave blue 4) might not be over at all. I counted the downward movement from the 1.17 high as red 1,2,3, now in 4. It would be more like a leading diagonal than an ending diagonal, because when we look at the structure of the waves red 1 and 3 they do look pretty impulsive.
The wave red 4 is now at the verge of invalidating this leading diagonal count. Above 1.1495 will not only invalidate the leading diagonal but also my main count at all, because the supposed to be wave blue 4 would transform into a larger sideways structure.
Generally speaking: the chance, that my main count is wrong are getting pretty high.
We had discussed earlier, that there is a pretty good chance, that the whole impulse down from the 1.399x high down to the 1.04x low is a finished impulse
One can count it as following:
Attached Image (click to enlarge)
Since the structure in the pattern since the 1.04x low has now clear impulsive starting pattern, chance is very high, that this all is only a sideways pattern.
Some questioned me, if the move from the 1.04x to the 1.17x high could not be counted as leading diagonal. Yes, it can be counted as leading diagonal, even the following decline was deep enough to justify this assumption.
But: leading diagonals most of the time have clear impulsive structure 5-3-5-3-5. This starting sequence from the low does have a pattern that looks for me like 3-3-3-3-3
Now will be decision time, if price will end the wave C here (then chances for a prolonged sideways movement is very high in form of a contracting triangle), or if we shoot higher (chance would than be high, that all of the overlapping movements since the 1.05 low were multiple 1-2 startsequences. In this case price may easily reach into the 1.2x territory.
At the moment i lean towards the immediate bearish case. In this case, we can count the movements up since the low on 03.24.2016 as ABC-x-ABC as shown below:
EU 1h TF
Attached Image (click to enlarge)
Fib confluences in the upmove
EU 2h TF
Attached Image (click to enlarge)
The current Daily Sentiment Index is around 73% bulls.
Retail trader are heavilly short at the moment, but have staggered their huge bullish bets just below of 1.13 according to Oanda and Saxo Bank (showing their longer term bullish mindset).
COT data show, that the commercials are further reducing their long positions, whereas the small and large trader are about to go long. Since the data of the COT is, as every time, from Tuesdays, the data is a bit lagging. Maybe we can see next week, that the large traders are net long and the Commercials are net short.
The COT Index is near an ideal position to think about short positions
Attached Image (click to enlarge)