{quote} And this why most traders fail. Rather than trading with price they trade against with prediction and their boxed in views about how they want to price to behave and what it should be doing rather than what it's actually doing. I guess that's why 95% of traders fails because their stuck in a world of illusions rather than reality.
Ignored
So you are the 5%; congratulation to you. You need not lurk around here for miracle to save your account.
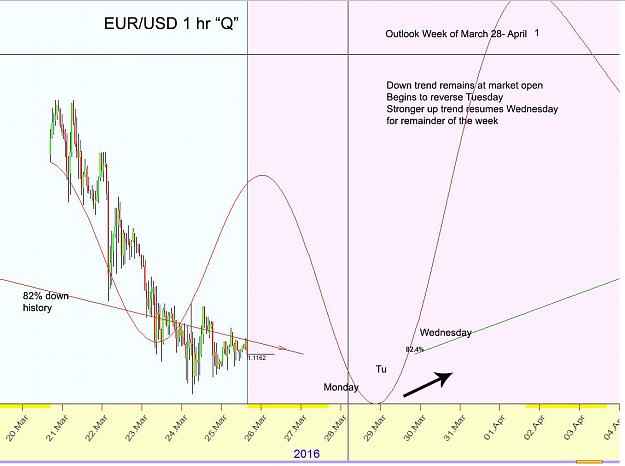
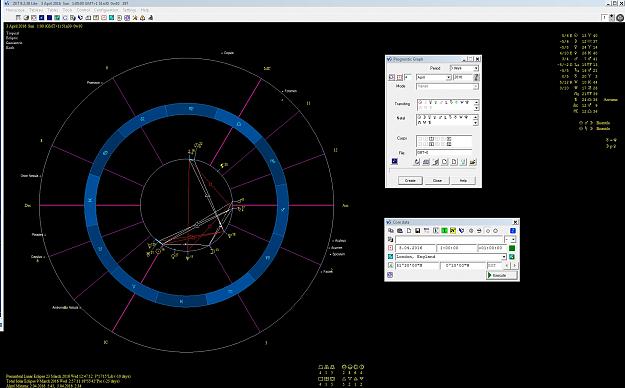
Timing Solution prediction for Week of March 28-April 1st Using 1 hr data and the newly developed "Q" spectrum module Weakness remains at market open, finding a bottom on Tuesday Market Trend north on Wednesday and holds for remainder of trading week. {image}
Ignored
nice chart I like that, thanks for your update! Looks similar to fourier transform.
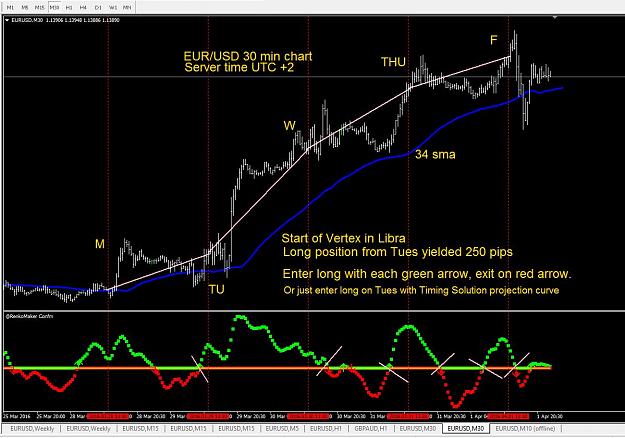
The Timing Solution "Q" prediction proved to be correct with the market heading north after the Tuesday bottom was hit. I continue to find the start of Vertex in Libra to be a nice timing device on the intraday chart from a week by week perspective.
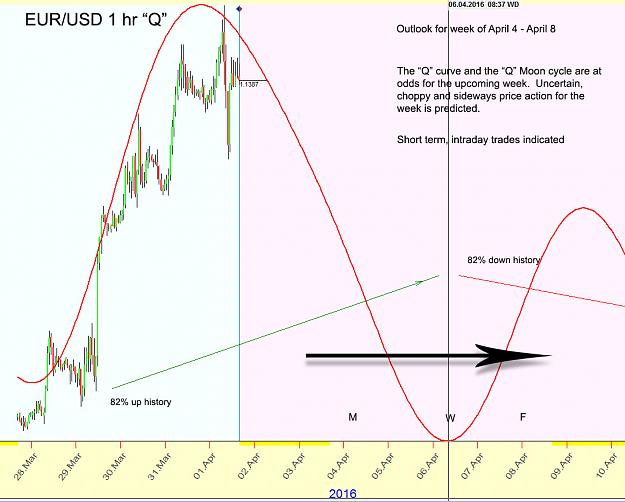
Uncertain, choppy outlook for most of the week.
Please don't take this as trading advice, except for demo accounts.
"Q" cycles and arrows are 82% accurate during the length of the data series I am working with which is 1 hr data going back to November 11, 2015.
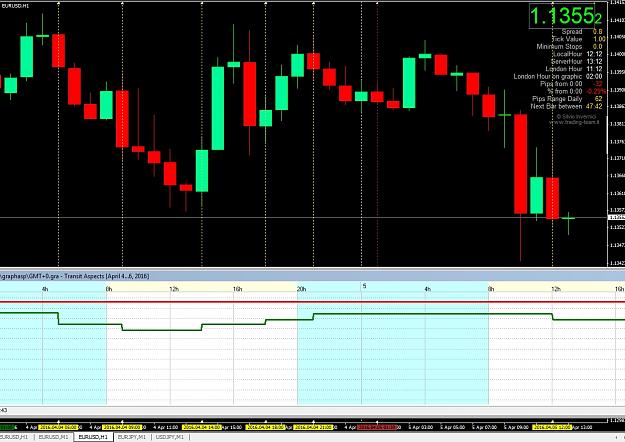
Weekly Recap, March 28 - April 1 The Timing Solution "Q" prediction proved to be correct with the market heading north after the Tuesday bottom was hit. I continue to find the start of Vertex in Libra to be a nice timing device on the intraday chart from a week by week perspective. {image} {image}
Ignored
jnevins, as far as I remember your indicator repaints badly. So, in theory it looks good, but in practice you shouldn't use it for real trading. That's my opinion.
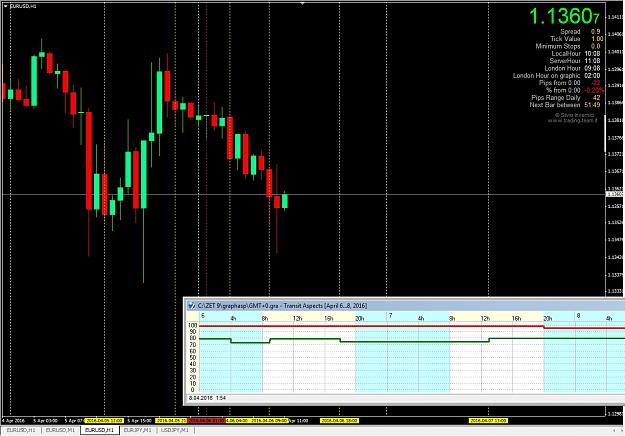
Next Week, April 4 -8 2016 Uncertain, choppy outlook for most of the week. Please don't take this as trading advice, except for demo accounts. "Q" cycles and arrows are 82% accurate during the length of the data series I am working with which is 1 hr data going back to November 11, 2015. {image}
Ignored
Mr. Jnevins, could You explain what is the meaning of O cycles ? is that the read cycle ?
could You explain more about the interpretation of the arrows up and down. in the picture, it shows that the arrow up until wednesday meanwhile the cycle was down since monday.
thanks Sir
{quote} jnevins, as far as I remember your indicator repaints badly. So, in theory it looks good, but in practice you shouldn't use it for real trading. That's my opinion. Regars, Karl
Ignored
Hi Karl,
The curve is not an "indicator". The software is Timing Solution, a statistical analysis program that specializes in the study of cycles from a mathematical/statistical point of view. In this case the cycle is related to the movement of the Moon... and is independent of the price action. The straight line up and down lines are a straight analysis that each time that cycle presented itself in the last x bars 82% of the time it went either up or down. That is not 100%... One always needs to keep a certain humility because if you treat this "prediction" as a certainty, you surely will get burned. I present these forward looking "predictions" with the intent of seeing how accurate they are as they are tracked into the future with real price action... last week worked out very well... (far above noise or randomness) ... this week looks inconclusive with the cycle at odds with the Moon "Q".... hence my note of caution. In any event, as I have pointed out over and over again in past posts, use your best technical analysis to decide on your trades in your favorite time frame and use the astro cycle information to help give a nudge or a push to your decision making when uncertain about the direction of an impending trend change.
{quote} Mr. Jnevins, could You explain what is the meaning of O cycles ? is that the read cycle ? could You explain more about the interpretation of the arrows up and down. in the picture, it shows that the arrow up until wednesday meanwhile the cycle was down since monday. thanks Sir
Ignored
Q stands for quantum, an approach the creator of the software, has been working on and refining for some time. Go here: http://www.timingsolution.com/ and click on the ??? link at the top of the page for many articles on how to use the software. Here is an article on Quantum data... http://www.timingsolution.com/TS/Art...versus_digits/
The straight lines are related to the Moon cycle and the curve is related to re-occurring harmonic waves... my current idea is that when both align, the probability of price moving that way is much higher than when they are at odds as it appears during the up coming week...
{quote} Q stands for quantum, an approach the creator of the software, has been working on and refining for some time. Go here: http://www.timingsolution.com/ and click on the ??? link at the top of the page for many articles on how to use the software. Here is an article on Quantum data... http://www.timingsolution.com/TS/Art...versus_digits/ The straight lines are related to the Moon cycle and the curve is related to re-occurring harmonic waves... my current idea is that when both align, the probability of...
Ignored
thanks Sir for the answer.
so You actually combine the astro with the software calculation, it is excellent to give more confident. looking forward to see more of Your works.
many thanks Mr. Jnevins.
you should follow the STD (Short Term Delta) cycle too - it has 12 turning points plus inversions.
The cycle lasts 4 calendar days and starts with "orange"
Here is the calendar for april.
how to know in advance the color of the future hourly candle?
Some are already written by the stars, it will be the opposite color to the previous ..... it is not charming?
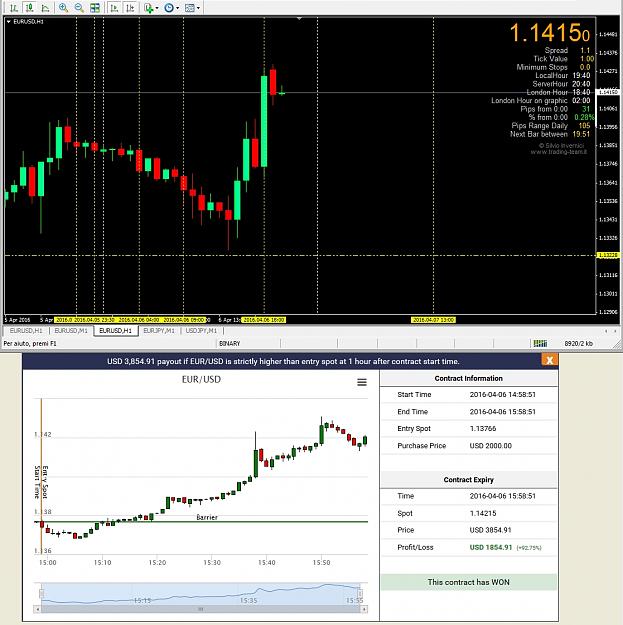
Hello, how to know in advance the color of the future hourly candle? Some are already written by the stars, it will be the opposite color to the previous ..... it is not charming? EURUSD example .......... {image} {image}
Ignored
Bingo,
Can you explain how you placed the vertical lines on the hourly chart? Do they correspond to your Astro chart somehow? Can you therefore place them in advance?
Interesting. If you can predict future movement of price based on how planets effect human behavior, how exactly does this account for high frequency and algorithmic trading that accounts for approximately 70% of all trading in currency markets?
I got a good idea, how about instead of flushing your money down the toilet using hocus pocus prediction why don't you just give it to me. I'll put to a good use since it wlil end up in someone's else's pockets anyways.
{quote} Bingo, Can you explain how you placed the vertical lines on the hourly chart? Do they correspond to your Astro chart somehow? Can you therefore place them in advance? JN
Ignored
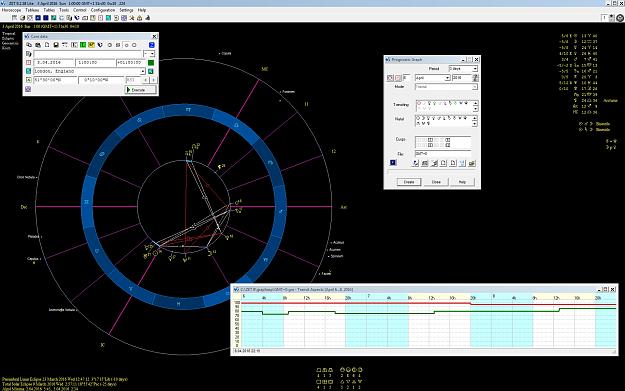
I do it manually. First I use ZET 9.2 software, if you setup like my image attached, using Prognostic Graph 3 days you get a graph where to copy time signal to MT4
As you can see core data is always setup on last Sunday.
As it works most of time, I do not know why, I do not try different setups.
I attached images for today and tomorrow EURUSD forecasts............. Let's see "hocus pocus" at work !