{quote} at least they drove it up again, quickly, so far what a dirty game - the big addresses can move the price wherever they like to have it. PERIOD. At least for a short time.......
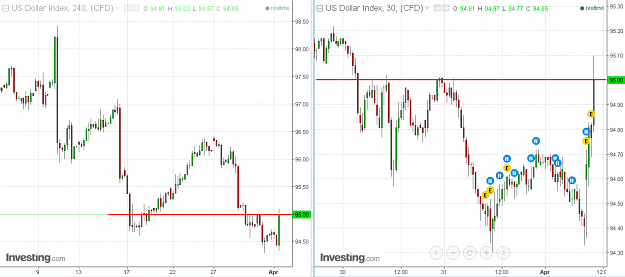
EU sentiment analysis derived from Oanda although over two-third of the traders have short positions in EU {image} the overall sentiment seems to be bullish the EU, because the vast majority of open orders are long orders {image}
Ignored
That is good time to shake them all out.
How do you think?
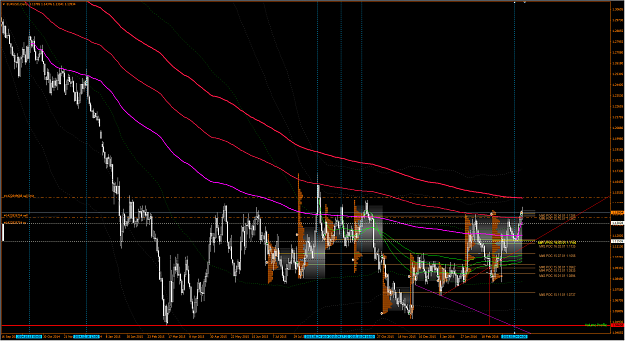
one ideas of many EU 30min TF {image} Suggestion is: when price breaks the upsloping channel, we may be in for, at least, a somewhat deeper retracement EU 67% bulls (inclining fast) Crude 67% bulls (declining slowly) Gold 51% bulls (neutral reading since nearly two weeks) DXY 37% bulls (decling fast) most retail broker outlets show heavy bearish positions in EU, but open orders data show, that the crowd seems to wait for slightly lower prices to go heavily long
Ignored
Yes, It is a very possible configuration.
That is what we have been thinking of before...
{quote} That is good time to shake them all out. How do you think? D.P. {quote} Yes, It is a very possible configuration. That is what we have been thinking of before... D.P. {image}
Ignored
You are thinking about selling over 1,15. Right. I've got 15'10 more or less. Do you think It will get there? I've got the RSI daily overbought.
{quote} You are thinking about selling over 1,15. Right. I've got 15'10 more or less. Do you think It will get there? I've got the RSI daily overbought.
Ignored
Yes and Yes.
As to RSI, it does not matter.
Price can go higher with drift, no strength.
on the chart I have marked the periods, where the traders were significantly net short or net long. The grey rectangles mark areas, where they had net losing positions.
Levels on the sentiment indicator below of 50 marks shorting, above 50 long positions.
It is a sad chart......
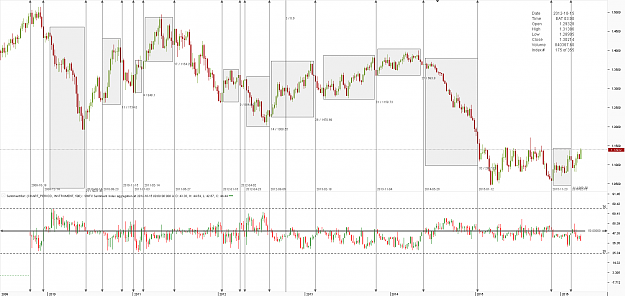
Interestingly enough, within this net losing periods, they often get it right. Example: price declines, and the retail traders build up their long positions. At the very turning points they often have their largest net long (or in case of declining prices net long positions).
But the crux is: they do not have the stamina to either go full in or to hold their then winning positions long enough.
They remind me a bit on commercial players (but without their deep pockets): in a downmove they keep on going long, and when the price turns they have accumulated fairly big positions.
When the price turns, they eventually already feel the pain from their deep under-water positions. When price runs in to their direction, they seem to be quick to take gains or neutralize their positions at/near break even.
How can we use this data?
It is really hard to say. The more the price is in a ranging position, the more the retail crowd is right at the positioning extremes.
In long lasting moves the crowd will be wrong over long periods of time.
It was titled: Euro Puts our Trading Strategy to a Real Test
Read it again.
Maybe you have read one book or another about COT data and analysis.
Most authors cautions to use the small traders data (that are also small banks, small funds etc.) to analyze the COT data. They told, that one can not make a proper forecast, because they are sometimes right and sometimes wrong.
They told to concentrate on the big players, the Commercials and the large traders.
{quote} You are thinking about selling over 1,15. Right. I've got 15'10 more or less. Do you think It will get there? I've got the RSI daily overbought.
Ignored
Yes and Yes.
As to RSI, it does not matter.
Price can go higher with drift, no strengh.
Actually at those levels I will be entering in order to be able to close both of the positions with a little profit.
I made a mistake and now I am trying to dissolve it by catching a bounce back.
I AM NOT TRYING TO SHORT AT THE HIGH. IT IS RISKY FOR NOW.
Positioning Data from SWFX weekly TF {image} on the chart I have marked the periods, where the traders were significantly net short or net long. The grey rectangles mark areas, where they had net losing positions. Levels on the sentiment indicator below of 50 marks shorting, above 50 long positions. It is a sad chart...... Interestingly enough, within this net losing periods, they often get it right. Example: price declines, and the retail traders build up their long positions. At the very turning points they often have their largest net long (or...
Ignored
Good background of the market.
Interesting to see..
{quote} Yes and Yes. As to RSI, it does not matter. Price can go higher with drift, no strength. D.P.
Ignored
Agree. RSI in daily is not a perfect indicator. I have seen the price moving in the same direction during weeks with the RSI overbought/oversold, but for a scalper means that longs ( at this moment) can be good, but be careful with them, and shorts could start to be good. It may means that a market can start to be exhausted, but not always.
keep in mind: when we trade live, we do not know, where a sentiment max/min is. That means, even when sentiment is, e.g., around 40, we do not know if it will drop further while price is marching higher.
We can try to figure out threshold levels. Based on my experience, levels above 56 can be considered EXTREME, as well as levels below 44
OK, let us look at the chart.
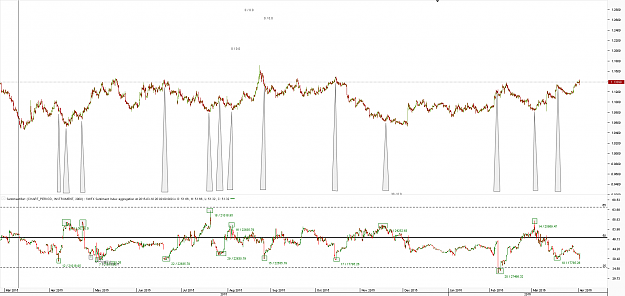
Remember the chart from yesterday, when I showed, that the traders are most of the time positioned wrong, but noted, that they seem to be right at the EXTREME points quite often.
So I took a look at the time since the low around 1.04 last year and now.
Marked on the chart are the extreme sentiment peaks and where they occurred. Interestingly enough, the traders would have won each of these bets, when they were not so quick to cover afterwards.
They are right at the turning points, but fail in the long run.
When one analyses the movements, one can see nearly everytime, that the traders accumulate losses while they scale into their trades. But when price finally turns, they immediately start to cover their positions. The scale-in phase spans over more pips than the covering phase. So conclusion is, that most of the trades are closed with a loss.
Attached Image (click to enlarge)
Keep in mind: this period of time was/is a sideways phase. We know, that most traders are doing well with figuring out the boundaries of sideways movement.
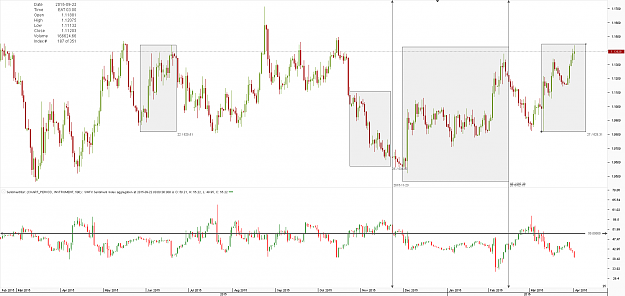
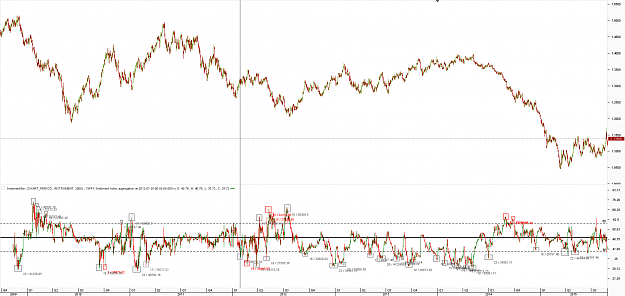
So let us have a look at the period from 2010 to 2015
Attached Image (click to enlarge)
The chart is daily TF
I have marked the sentiment extremes with rectangles, and then analyzed if it would have been profitable or not. On the chart the red rectangles are failed trades, the grey ones the profitable ones. I have marked 33 winning trades, and 6 losing ones.
When we look into the winning trades, many of them happen as counter trades. Many of them are in circumstances, where price makes several hundred pip moves in the main direction, and the trades are placed often for 100-150 winning pips on counter moves
What can we learn:
At sentiment extremes the traders are far more often right than wrong. I think, based on all what I have seen so far, that the traders are right at extreme points in over 80-85% of the cases.
Generally, the traders are wrong.
If one places bets on the extreme sentiment points, eventually one has to be quick to take profit.
Especially interesting I found their behaviour around the 1.399x top in 2014. The traders were building up their short positions over many months. They got the major turning point right.
But they covered collectively after a drop of around 500 pips completely and went long over many month while price dropped another 1000 pips
Something is worth noting: the traders seem to be good at determining the support and resistance zones.