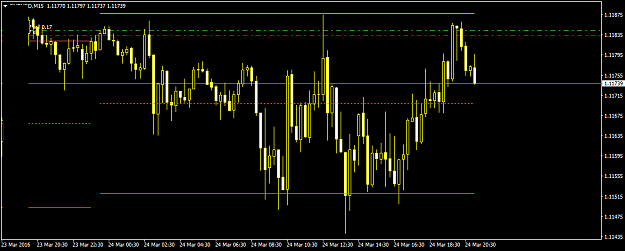
3 day weekend coming. statistically about 60%ish of the time a green close. if correct about uj.. that green close mostly opposite of stuff i look at. statistically using that 60 plus %, my trades are suckers bets today. i have most dead cats and a larger norm uj retrace back by the one to 112.91 in my favor. it still has room.. i dont think much more. i may be wrong.
Ignored
dow, nasdaq up,, sp slightly down
those who can, do. those who cant, talk about those who can
{quote} This http://www.forexfactory.com/showthre...84#post8314984. It counts how many times an instrument was at a certain price over time, so you can see which levels were fought over and which ones price barely spent any time at.
Ignored
Hi Miss
the indicator seems interesting
however it is hard from the quoted post to understand how exactly the parameters are used:
"bar awal: how many bars to count (I use it with the green vertical on the left, not counting bars)
bar akhir: start from -bar on the right (again use right vertical)"
-> what is this "vertical"?
bar awal -> is this the number of bars on the current timeframe, based on which the histogram is made?
is there a way to set-up how many levels above and below the current price are shown in the histogram?
Joined Apr 2013
|
Status: I'm learnding!
|8,973 Posts
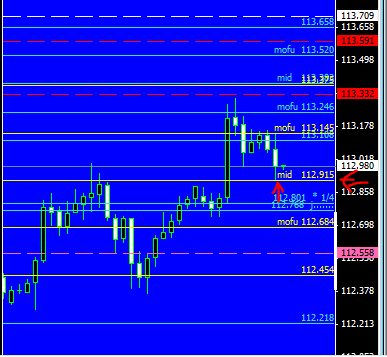
UJ close not at all what I expected. Something is up, maybe another short opportunity 113.41
looking left trying to find some guidance, not many times a daily doji is eaten like that, not just a daily doji eaten, but a doji off a perfect norm retrace is considerably more rare...but then again could just mean nothing. If EU is in line, then UJ should be in line.....makes me suspect boj manipulation but that's stupid, no way to know one way or another.
Suspect the UJ upmove is BS
tomorrow-monday low liquidity. If a miss on GDP then I'm expecting a very sharp move down in UJ, move up EU to bring both inline technically. Otherwise kiss this trade goodbye
Joined Oct 2008
|
Status: sideline is a position
|105,254 Posts
uj approaching 113.38, that was the smaller* norm.. the 2 norms at 112.91/114.54 and 113.38/114.8 void 114.54+ and 114.86+.. holiday weekend.. 113.38 may be a s/r.. a close s/r at 113.59 and 113.33.
those who can, do. those who cant, talk about those who can
UJ close not at all what I expected. Something is up, maybe another short opportunity 113.41 looking left trying to find some guidance, not many times a daily doji is eaten like that, not just a daily doji eaten, but a doji off a perfect norm retrace is considerably more rare...but then again could just mean nothing. If EU is in line, then UJ should be in line.....makes me suspect boj manipulation but that's stupid, no way to know one way or another. Suspect the UJ upmove is BS tomorrow-monday low liquidity. If a miss on GDP then I'm expecting a...
Ignored
its either good or not..
those who can, do. those who cant, talk about those who can
uj approaching 113.38, that was the smaller* norm.. the 2 norms at 112.91/114.54 and 113.38/114.8 void 114.54+ and 114.86+.. holiday weekend.. 113.38 may be a s/r.. a close s/r at 113.59 and 113.33.
{quote} Hi Miss the indicator seems interesting however it is hard from the quoted post to understand how exactly the parameters are used: "bar awal: how many bars to count (I use it with the green vertical on the left, not counting bars) bar akhir: start from -bar on the right (again use right vertical)" -> what is this "vertical"? bar awal -> is this the number of bars on the current timeframe, based on which the histogram is made? is there a way to set-up how many levels above and below the current price are shown in the histogram? Thanks
Ignored
Try asking the OP. The doc for it isn't in English, and my understanding of it is from an earlier version that the source code was posted for, which doesn't have the green bar, so I don't really know what you use the green bar for. The source code for this one, which is nicer because you have the bell curve option and the two lines you can drag to get the range you want, wasn't posted. I didn't understand what you meant by a way to set up how many levels above and below are shown. As far as I can tell it accumulates the curve based on how much history you have loaded for the selected timeframe, and where the two dotted vertical lines are. (That is, as far as I can see, it counts how many times price hit each point between the dates selected by the two vertical bars, as long as you have enough history to do that on the timeframe you are counting for.)
Joined Oct 2008
|
Status: sideline is a position
|105,254 Posts
111.64 looks wanted..a possible L after , but larger bears just needed 111.91, that was done.. bears may not allow the long after 111.64.. if one's analysis indicates long at 111.64, a possible 113.7x target.. i shorted the bounce looking for 106.x and less.
those who can, do. those who cant, talk about those who can