The goal of this fully mechanical method is to capture trends. Since it's my belief that the past doesn't equal the future and thus you can't predict when a trend will begin (or end), it's best to let the market dictate your position. Hence the use of volatility. To me, volatility measures the amount of price movement, up and down, from a given starting point within a given time period. Therefore, intrinsic in the aforementioned definition, volatility has a short-range directional bias, i.e. for a specific slice of time and relative to a fixed starting point, if the "up" price movement is greater than the "down" price movement, then the directional bias is up. Vice versa if the price movement down is greater than the price movement up. This is obvious to anyone who can look at a bar on a chart of any time frame and reference that bar to a previous bar. However, the degree (strength) by which a market moves away and stays away from a given starting point over time is what we call "trend", and so trend is nothing more than a directional string of volatile price moves away from a given starting point over a given period of time. IMO, volatility can't predict the onset, continuation, or ending of a trend, but on any given time frame volatility can show a market's current directional bias. Hence the reason to use volatility to enter a position and to set the stoploss. In each case, whether volatility gets us into a market or hits a stop loss, volatility is showing a directional bias within that given slice of time. Whether that directional bias continues or not over a longer time span can't be predicted, but it IS a potential starting point...and as we know, all trends have a starting point.
The volatility assessment used in this method is based on the weekly ATR (look-back =20 weeks); a percentage of this volatility (20%) sets the initial position straddle, the placement of the initial stoploss, and the locations of the target points which determine when (and where) the stop should be moved and when positions should be added (for those who like to "millipede" their gains). I use the 20% weekly ATR since it gives the market space to "sort itself out" at the beginning of the week. This percentage is not set in stone so adjust it as you wish- but be aware that a lower percentage will increase the frequency of whipsaws. As you can guess, this method will suffer numerous small losses and scratch trades, especially when the market is ranging, but it will allow you to ride trends as they develop, and just as important to me, will limit profit losses when a profitable trend undergoes a deep retracement. This is not a "set & forget" method since you have to actively manage your position(s). For me, this means having price alerts sent to my phone when target levels are reached (hence I will have to move my stop) or that a stop was hit (hence I will have to set my next buy/sell "re-entry" positions). There are no "take profit" levels per se (I'll let the market retrace and take me out of a position), but take profits can be included (the placement of take profit levels is left up to the individual trader). There are lots of ways that this approach can be used in combination with other trading methods, especially for those who are support/resistance traders and swing traders.
There is nothing new described in this method that hasn't already been discussed elsewhere on FF, but those threads typically got bogged down and eventually died when folks introduced various "filters" and such to try to mitigate the whipsaws, eventually to no avail....but with that said, feel free to make this method your own and post your results...we can all learn something new by reading about the various nuances by which traders use this method. I will keep track of my trades (live) starting this week...please join along if you'd like to track your trades as well. If you have questions, please feel free to ask...also, I like to constantly edit this first post only to make sure that the important points are clearly explained...
Good trading to all,
Dave
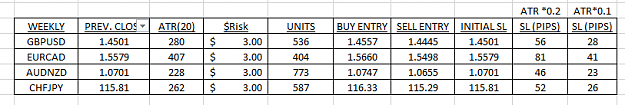
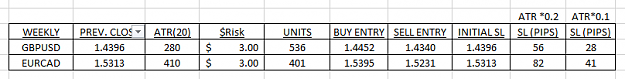
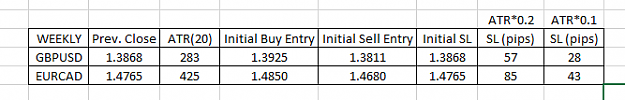
Initial entry
ATR = weekly; range = 20
ATR multiplier = 0.2
Buy entry = Previous week's close + (weeklyATR*0.2)
Sell entry = Previous week's close - (weeklyATR*0.2)
initial stop placement = previous week's close
NOTE#1: the "previous week's close" is just a placement for those who like to use the weekly close as a starting bench mark for trading the upcoming week. If you are placing your initial trade later in the week, then you can open the position immediately (buy or sell) and use the 20% weeklyATR stop as a reversal point, or you can use the criteria for the "Re-entry trade" as described below.
trailing stop:
For buy position:
1) move stop to break-even when P/L = entry+(weeklyATR*0.2) pips
2) move stop to entry+(weeklyATR*0.2) pips when P/L = entry+(weeklyATR*0.4) pips
3) move stop to entry+(weeklyATR*0.4) pips when P/L = entry+(weeklyATR*0.6) pips
4) move stop to entry+(weeklyATR*0.6) pips when P/L= entry+(weeklyATR*0.8) pips
5) move stop to entry+(weeklyATR*0.8) pips when P/L= entry+(weeklyATR*1) pips
For sell position:
1) move stop to break-even when P/L = entry-(weeklyATR*0.2) pips
2) move stop to entry-(weeklyATR*0.2) pips when P/L = entry-(weeklyATR*0.4) pips
3) move stop to entry-(weeklyATR*0.4) pips when P/L = entry-(weeklyATR*0.6) pips
4) move stop to entry-(weeklyATR*0.6) pips when P/L= entry-(weeklyATR*0.8) pips
5) move stop to entry-(weeklyATR*0.8) pips when P/L= entry-(weeklyATR*1) pips
NOTE#2: additional positions can be opened at price targets "2-5".
Re-entry (when stopped out):
buy entry = current price + (weeklyATR*0.1)
sell entry = current price - (weeklyATR*0.1)
initial stop placement for re-entry trade:
For buy: current price - (weeklyATR*0.1)
for sell: current price + (weeklyATR*0.1)
Note#3: with re-entry trades, 10 percent of the weekly ATR is used for the position straddle and the placement of the initial re-entry stop... the rationale for using a lower volatility range (relative to the 20% weekly ATR used in the initial position straddle and stop placement to start the week) is the following: you were already in a position and caught a nice trend only to be stopped out due to a retracement, or you were in a position that was caught in a ranging market. Either way, you now want to open a position but want the market to move in a definitive direction before entering again. Placing a position straddle at +/- 10% of the weeklyATR of the just-exited price appears to be a good launching point for the market to establish a directional move. If the market begins to trend, then you have risked little (10% of the weekly ATR) for a potentially larger gain. On the other hand, if the market continues to range, then you have risked little (10% of the weekly ATR) probing the market waiting for a trend to emerge. If you desire to minimize whipsaw, use the 20% weekly ATR to set up the position straddle.
NOTE#4: the 10% weeklyATR straddle is ONLY for the initial re-entry and initial stop placement. Thereafter, the stop is moved for every Pip P/L increment of 20% of the weekly ATR as described in steps 1-5 above. Positions can be added at price targets "2-5" (see note #2).
NOTE#5: Position size (units) = $Risk / (Pip value x (weeklyATR x 0.2))
I trade with Oanda, so "position size" is designated as "units" where 1 unit equals the buying/selling of 1 pip value of the traded currency pair
NOTE#6: When I started trading this method, I was SMACKED (whipsawed) on big news days... just be aware that mature trends can undergo DEEP retracements during news events before resuming the original trend. Learned my lesson.... I've opted NOT to re-enter a market for an hour or so after a news event until I deem that the volatility (30 minute) has normalized (news-related volatility makes the use of the %weeklyATR stop irrelevant)...
The pairs I'll be trading are shown below (don't be surprised if this list is modified later on). These pairs were selected because they have weekly inter-pair Directional Similarity values of 45-60%..
The volatility assessment used in this method is based on the weekly ATR (look-back =20 weeks); a percentage of this volatility (20%) sets the initial position straddle, the placement of the initial stoploss, and the locations of the target points which determine when (and where) the stop should be moved and when positions should be added (for those who like to "millipede" their gains). I use the 20% weekly ATR since it gives the market space to "sort itself out" at the beginning of the week. This percentage is not set in stone so adjust it as you wish- but be aware that a lower percentage will increase the frequency of whipsaws. As you can guess, this method will suffer numerous small losses and scratch trades, especially when the market is ranging, but it will allow you to ride trends as they develop, and just as important to me, will limit profit losses when a profitable trend undergoes a deep retracement. This is not a "set & forget" method since you have to actively manage your position(s). For me, this means having price alerts sent to my phone when target levels are reached (hence I will have to move my stop) or that a stop was hit (hence I will have to set my next buy/sell "re-entry" positions). There are no "take profit" levels per se (I'll let the market retrace and take me out of a position), but take profits can be included (the placement of take profit levels is left up to the individual trader). There are lots of ways that this approach can be used in combination with other trading methods, especially for those who are support/resistance traders and swing traders.
There is nothing new described in this method that hasn't already been discussed elsewhere on FF, but those threads typically got bogged down and eventually died when folks introduced various "filters" and such to try to mitigate the whipsaws, eventually to no avail....but with that said, feel free to make this method your own and post your results...we can all learn something new by reading about the various nuances by which traders use this method. I will keep track of my trades (live) starting this week...please join along if you'd like to track your trades as well. If you have questions, please feel free to ask...also, I like to constantly edit this first post only to make sure that the important points are clearly explained...
Good trading to all,
Dave
Initial entry
ATR = weekly; range = 20
ATR multiplier = 0.2
Buy entry = Previous week's close + (weeklyATR*0.2)
Sell entry = Previous week's close - (weeklyATR*0.2)
initial stop placement = previous week's close
NOTE#1: the "previous week's close" is just a placement for those who like to use the weekly close as a starting bench mark for trading the upcoming week. If you are placing your initial trade later in the week, then you can open the position immediately (buy or sell) and use the 20% weeklyATR stop as a reversal point, or you can use the criteria for the "Re-entry trade" as described below.
trailing stop:
For buy position:
1) move stop to break-even when P/L = entry+(weeklyATR*0.2) pips
2) move stop to entry+(weeklyATR*0.2) pips when P/L = entry+(weeklyATR*0.4) pips
3) move stop to entry+(weeklyATR*0.4) pips when P/L = entry+(weeklyATR*0.6) pips
4) move stop to entry+(weeklyATR*0.6) pips when P/L= entry+(weeklyATR*0.8) pips
5) move stop to entry+(weeklyATR*0.8) pips when P/L= entry+(weeklyATR*1) pips
For sell position:
1) move stop to break-even when P/L = entry-(weeklyATR*0.2) pips
2) move stop to entry-(weeklyATR*0.2) pips when P/L = entry-(weeklyATR*0.4) pips
3) move stop to entry-(weeklyATR*0.4) pips when P/L = entry-(weeklyATR*0.6) pips
4) move stop to entry-(weeklyATR*0.6) pips when P/L= entry-(weeklyATR*0.8) pips
5) move stop to entry-(weeklyATR*0.8) pips when P/L= entry-(weeklyATR*1) pips
NOTE#2: additional positions can be opened at price targets "2-5".
Re-entry (when stopped out):
buy entry = current price + (weeklyATR*0.1)
sell entry = current price - (weeklyATR*0.1)
initial stop placement for re-entry trade:
For buy: current price - (weeklyATR*0.1)
for sell: current price + (weeklyATR*0.1)
Note#3: with re-entry trades, 10 percent of the weekly ATR is used for the position straddle and the placement of the initial re-entry stop... the rationale for using a lower volatility range (relative to the 20% weekly ATR used in the initial position straddle and stop placement to start the week) is the following: you were already in a position and caught a nice trend only to be stopped out due to a retracement, or you were in a position that was caught in a ranging market. Either way, you now want to open a position but want the market to move in a definitive direction before entering again. Placing a position straddle at +/- 10% of the weeklyATR of the just-exited price appears to be a good launching point for the market to establish a directional move. If the market begins to trend, then you have risked little (10% of the weekly ATR) for a potentially larger gain. On the other hand, if the market continues to range, then you have risked little (10% of the weekly ATR) probing the market waiting for a trend to emerge. If you desire to minimize whipsaw, use the 20% weekly ATR to set up the position straddle.
NOTE#4: the 10% weeklyATR straddle is ONLY for the initial re-entry and initial stop placement. Thereafter, the stop is moved for every Pip P/L increment of 20% of the weekly ATR as described in steps 1-5 above. Positions can be added at price targets "2-5" (see note #2).
NOTE#5: Position size (units) = $Risk / (Pip value x (weeklyATR x 0.2))
I trade with Oanda, so "position size" is designated as "units" where 1 unit equals the buying/selling of 1 pip value of the traded currency pair
NOTE#6: When I started trading this method, I was SMACKED (whipsawed) on big news days... just be aware that mature trends can undergo DEEP retracements during news events before resuming the original trend. Learned my lesson.... I've opted NOT to re-enter a market for an hour or so after a news event until I deem that the volatility (30 minute) has normalized (news-related volatility makes the use of the %weeklyATR stop irrelevant)...
The pairs I'll be trading are shown below (don't be surprised if this list is modified later on). These pairs were selected because they have weekly inter-pair Directional Similarity values of 45-60%..
Attached Image (click to enlarge)