I wonder if any coder would like to give it a try, and create an scrip that alert you when the buy or sell signals are present.
Update i just made USD$65.00 in about 3 minutes using part of this system.
1 day profits USD$256.00
Hi coder, i found this info, and i think that we can make some money using this idea.i used in the 5 minutes chart to go long AUD/USD.
I see that it worked to find the point to enter for position trading too,using the daily.
Big money was made with just 2 signal to go short.
thanks here are the trading rules:
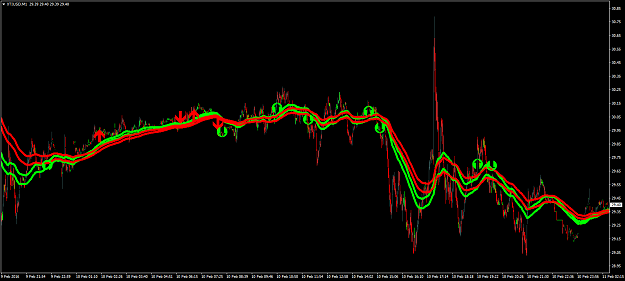
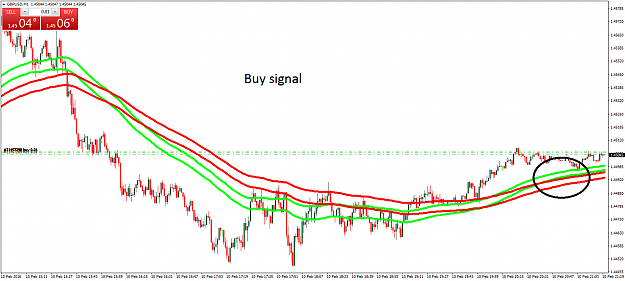
The procedure here is to plot 4 lines on your Meta trader platform. Two 89 EMA and two 144 EMA lines. The steps are;
Go to your indicator, choose moving average and fill in the following parameters;
(i) Period 89 shift 0
MA method Exponential
Apply to high
Style e.g. white.
(ii) Period 89 shift 0
MA method Exponential
Apply to low
Style still white.
(iii) Period 144 shift 0
MA method Exponential
Apply to high
Style e.g. yellow.
(iv) Period 144 shift 0
MA method Exponential
Apply to low
Style still yellow.
BUYwhen the two 89 EMA line immediately crosses above the two 144 EMA line. Should you were not there at the crossover and you perhaps meet the market when the two 89 EMA are still up, this still means that the buyers are still in control, then you should think more of buying. However, a disadvantage here is that you do not know if you will be entering at the end of the trend.
SELL when the two 144 EMA line immediately crosses above the two 89 EMA line. Should you were not there at the crossover and you perhaps meet the market when the two 144 EMA are still up, this still means that the sellers are still in control, then you should think more of selling. However, a disadvantage here is that you do not know if you will be entering at the end of the trend.
Things to note
1. The signal here is to be strictly followed using the 1 min time frame. 5 min can either support it or be used for swing trading.
2. This indicator is best for generally volatile currency pairs e.g. all yen pairs, GBPCHF, GBPUSD or any currency pair under a very volatile market condition that last for hours.
3. One on one crossing at times should be followed skeptically, however two on two crossing completely confirms the direction.
4. Whenever the four lines are interwoven, this means that the market is sideways. Hence, you adopt a different trading approach e.g. scalping once or twice maximum.
5. This is a trend indicator just like your MACD. It does not respond to the individual retracements along a trend. A total break out confirms an end to the previous trend.
6. Your candlestick has to be as small as mine, if possible, zoom your chart to lowest. If you are a trader that loves reading candlestick, I believe you should know its a nuisance doing on a 1 min chart.
7. Following the signals or using them for your entries are usually very good when you are trading in the direction of the major trend. Well, I believe you know you have to use higher time frames e.g 4hr, Daily to determine direction of major trends. For example presently in the market the major trends for most common pairs is down, you can then use this indicator to know when to sell.
8. This indicator can be very good on a powerfully trending day where the market is powerfully facing a direction. The issue here is it still tells you not to do the otherwise yet if you are a trend trader.
9. This indicator just like others will never tell you the beginning nor the end of a trend Well, I believe only God can.
10. Good for intra-day and swing traders. position traders stay away.
http://www.forexfactory.com/showthread.php?t=105350
Update i just made USD$65.00 in about 3 minutes using part of this system.
1 day profits USD$256.00
Hi coder, i found this info, and i think that we can make some money using this idea.i used in the 5 minutes chart to go long AUD/USD.
I see that it worked to find the point to enter for position trading too,using the daily.
Big money was made with just 2 signal to go short.
thanks here are the trading rules:
The procedure here is to plot 4 lines on your Meta trader platform. Two 89 EMA and two 144 EMA lines. The steps are;
Go to your indicator, choose moving average and fill in the following parameters;
(i) Period 89 shift 0
MA method Exponential
Apply to high
Style e.g. white.
(ii) Period 89 shift 0
MA method Exponential
Apply to low
Style still white.
(iii) Period 144 shift 0
MA method Exponential
Apply to high
Style e.g. yellow.
(iv) Period 144 shift 0
MA method Exponential
Apply to low
Style still yellow.
BUYwhen the two 89 EMA line immediately crosses above the two 144 EMA line. Should you were not there at the crossover and you perhaps meet the market when the two 89 EMA are still up, this still means that the buyers are still in control, then you should think more of buying. However, a disadvantage here is that you do not know if you will be entering at the end of the trend.
SELL when the two 144 EMA line immediately crosses above the two 89 EMA line. Should you were not there at the crossover and you perhaps meet the market when the two 144 EMA are still up, this still means that the sellers are still in control, then you should think more of selling. However, a disadvantage here is that you do not know if you will be entering at the end of the trend.
Things to note
1. The signal here is to be strictly followed using the 1 min time frame. 5 min can either support it or be used for swing trading.
2. This indicator is best for generally volatile currency pairs e.g. all yen pairs, GBPCHF, GBPUSD or any currency pair under a very volatile market condition that last for hours.
3. One on one crossing at times should be followed skeptically, however two on two crossing completely confirms the direction.
4. Whenever the four lines are interwoven, this means that the market is sideways. Hence, you adopt a different trading approach e.g. scalping once or twice maximum.
5. This is a trend indicator just like your MACD. It does not respond to the individual retracements along a trend. A total break out confirms an end to the previous trend.
6. Your candlestick has to be as small as mine, if possible, zoom your chart to lowest. If you are a trader that loves reading candlestick, I believe you should know its a nuisance doing on a 1 min chart.
7. Following the signals or using them for your entries are usually very good when you are trading in the direction of the major trend. Well, I believe you know you have to use higher time frames e.g 4hr, Daily to determine direction of major trends. For example presently in the market the major trends for most common pairs is down, you can then use this indicator to know when to sell.
8. This indicator can be very good on a powerfully trending day where the market is powerfully facing a direction. The issue here is it still tells you not to do the otherwise yet if you are a trend trader.
9. This indicator just like others will never tell you the beginning nor the end of a trend Well, I believe only God can.
10. Good for intra-day and swing traders. position traders stay away.
http://www.forexfactory.com/showthread.php?t=105350
Attached Image (click to enlarge)
he, alone, was to blame for his losses in the zero-sum game