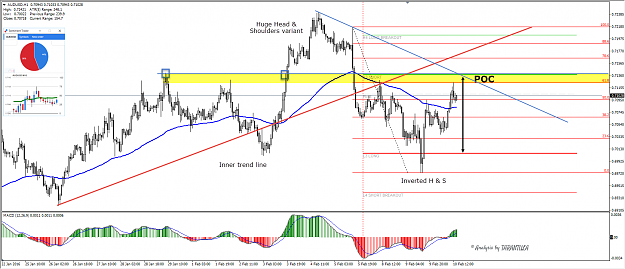
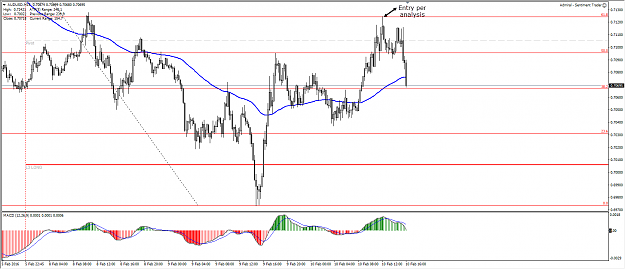
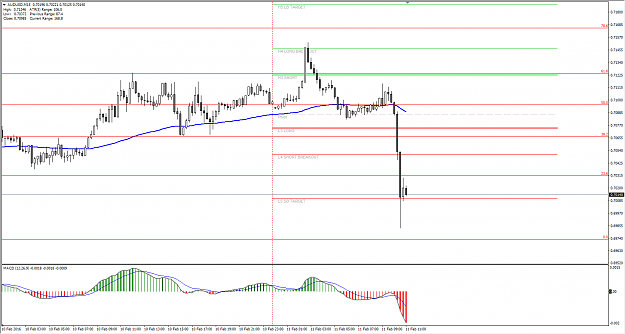
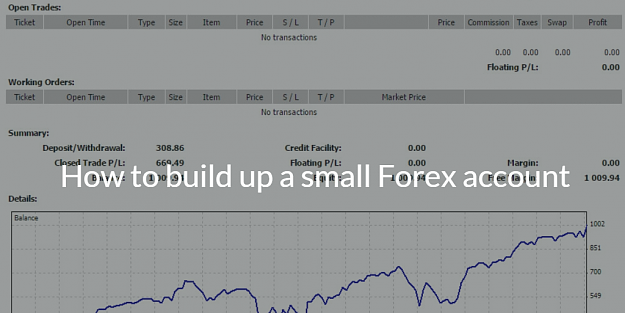
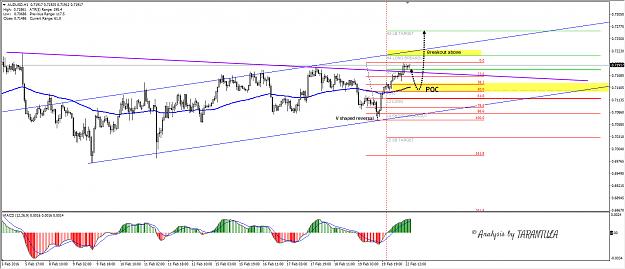
Disliked{quote} Thank you D Basically it took me app 6 month to complete the method which is suitable for Low to High build up. The method is named ACCU PP method and it has been developed the same time with HARP. I always put small amount of money to actually test LIVE performance and of course as with any project I had losses initially. The losses are actually good ( I always take it as normal, production expenses ) because you can see where the real strength and weakness of the system is. After some initial losses after we have completed the method I...Ignored
Looks really impresive.
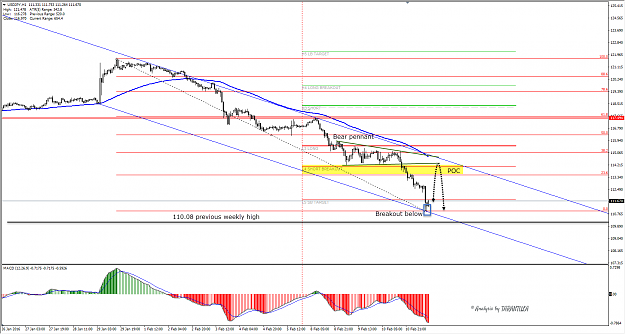
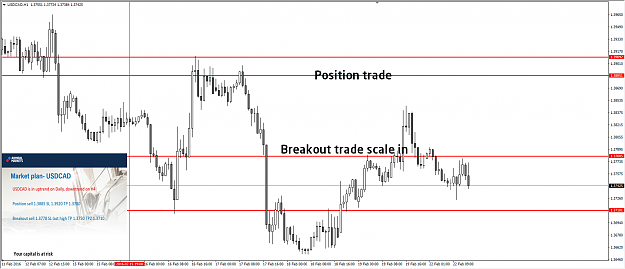
You opened manually trades or you had ACCU PP, HARP CAMMACD as Expert advisors?