Hi guys Just wondering if someone saw that coming...40 up since the opening...if yes...based on what...Thanks to let me know shinny, Forex samsam on what side are you? As usual l took the wrong one... Ah.....not easy....
Ignored
Can you post ur entry please? I think u entry short in bottom.
Based on daily and H2 setting provided by indicators as far as l understand...yes l took a short expecting a continuation of the down trend around 130.178...saw no apparent reason for that reverse...except a news that l was not aware of...So now my stop lost is boosted...have to do 80P to retake
{quote} Go to Tools/Options/Events - double click alert.wav - IMPORTANT.... you have to click 'Choose other...' otherwise it won't keep. WAV goes in the sounds folder. Hope this helps.
Ignored
Thank you. That showed me that the file I selected was a midi file so I had to convert it to .wav and works fine now.
H Contrax Where you talking to me?...If yes... Based on daily and H2 setting provided by indicators as far as l understand...yes l took a short expecting a continuation of the down trend around 130.178...saw no apparent reason for that reverse...except a news that l was not aware of...So now my stop lost is boosted...have to do 80P to retake
Ignored
Yes I was talking to you. Remember a good quote: "Always Sell at Resistance... Buy at Support"... ALWAYS.... So if the market is far away from Resistance... you should wait for the price go to you.. Remember another quote "Dont chase the market... Always let the market go to you...".
I created a Skype Group that im only allowing members who is studyng and very active trying too understand this Paradox Treasure. Some Members of the group go short from 130.650 at Parabolic plus Fib 61.8 .
We are trying to understand this System and we are focus only in EURJPY from Now. (And maybe the only one.. since Dana is trading only EURJPY..)
Can you be more specific on what support resistance you refer to and what TF please
Edit : Contrax:you probably refer to 61.8 H1 but what about support on my initial sell didn't see any support.... except EMA on daily are you refering on this one?
Thanks for your offer for Skype group...l may be interesting... keep you posted
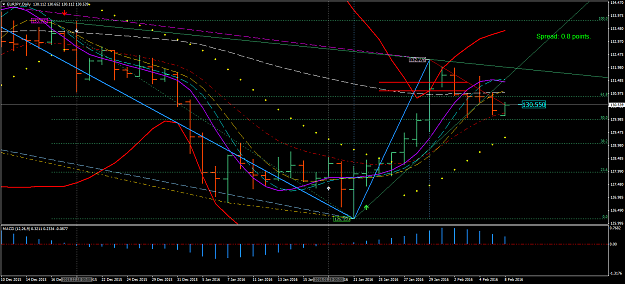
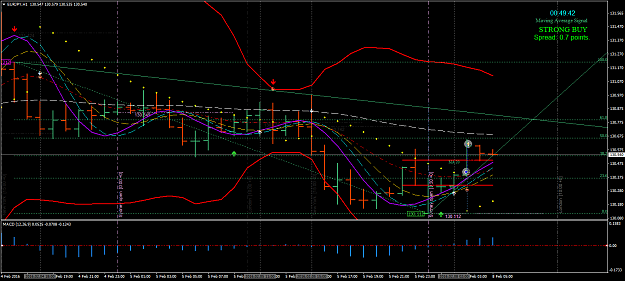
I went long on the H1 EURJPY. Reasoning: EMA is below ROMAR on all three charts. However, EMA is support on the daily. Market at EMA on Daily. H2 - market open above purple and white. H1- white cross purple, then smooth cross purple. Then PSAR flipped, entry at the open. Took profit at H2 ROMAR for 20 pips. {image} {image}
Ignored
Yes that was good. One member of the group make his Long at the start of the market. I didnt because D1 purple cross white and, H2 horsemen are for the down. So was a little retrace.
Have edited my previous post... you may not have noticed...
Wondering my Daily fib is actually red...
JMaurice's one is green...Am l ok? what about you?
Can you be more specific on what support resistance you refer to and what TF please
Edit : Contrax:you probably refer to 61.8 H1 but what about support on my initial sell didn't see any support.... except EMA on daily are you refering on this one?
Thanks for your offer for Skype group...l may be interesting... keep you posted
Hi Contrax Have edited my previous post... you may not have noticed... Wondering my Daily fib is actually red... JMaurice's one is green...Am l ok? what about you? Can you be more specific on what support resistance you refer to and what TF please Edit : Contrax:you probably refer to 61.8 H1 but what about support on my initial sell didn't see any support.... except EMA on daily are you refering on this one? Thanks for your offer for Skype group...l may be interesting... keep you posted
Ignored
Make sure your screen shows 40 bars; then it will show whatever it was intended to per Dove.
Hi Contrax Have edited my previous post... you may not have noticed... Wondering my Daily fib is actually red... JMaurice's one is green...Am l ok? what about you? Can you be more specific on what support resistance you refer to and what TF please Edit : Contrax:you probably refer to 61.8 H1 but what about support on my initial sell didn't see any support.... except EMA on daily are you refering on this one? Thanks for your offer for Skype group...l may be interesting... keep you posted
Ignored
You was far away from Resistance. Always buy on Support, and Sell at Resistance. If u are in the middle, do no enter to the market.. Wait to the market go to Support or Resistance, and from there take the decision.
{quote} Yes that was good. One member of the group make his Long at the start of the market. I didnt because D1 purple cross white and, H2 horsemen are for the down. So was a little retrace.
Ignored
Yes, I agree the H2 was not good for the trade I took, hence why I targeted 20 pips versus 40.
My question: All three charts show a downtrend because the EMA is below ROMAR on all three charts. However, EMA and Smooth are support on the daily, and the 4 Horsemen are support on the H1. So I believe we are currently in consolidation; is that incorrect?
{quote} Yes, I agree the H2 was not good for the trade I took, hence why I targeted 20 pips versus 40. My question: All three charts show a downtrend because the EMA is below ROMAR on all three charts. However, EMA and Smooth are support on the daily, and the 4 Horsemen are support on the H1. So I believe we are currently in consolidation; is that incorrect?
Ignored
I think that u are right, we are in Consolidation... but if the price still going down, we are going to be in a down trend.
Quoting ben.deschain
Hi Contrax Have edited my previous post... you may not have noticed... Wondering my Daily fib is actually red... JMaurice's one is green...Am l ok? what about you? Can you be more specific on what support resistance you refer to and what TF please Edit : Contrax:you probably refer to 61.8 H1 but what about support on my initial sell didn't see any support.... except EMA on daily are you refering on this one? Thanks for your offer for Skype group...l may be interesting... keep you posted
You was far away from Resistance. Always buy on Support, (What TF H2 or H1?According to Master Dove it is H2) and Sell at Resistance. If u are in the middle, do no enter to the market.. Wait to the market go to Support or Resistance, and from there take the decision.
{quote} I think that u are right, we are in Consolidation... but if the price still going down, we are going to be in a down trend.
Ignored
Right - I'm trying not to anticipate.
Daily: White has crossed Purple on the Daily eliminating PSAR as support, but Smooth and EMA are still support.
H2: White has now crossed Purple, eliminating PSAR as resistance, and Purple is approaching Smooth for a potential cross. However, EMA is resistance and ROMAR is not far away from the market.
H1: EMA and 4 Horseman are all support, but ROMAR is resistance and it is not far away.
{quote} I know but I live in Ireland and Looking at it. MY GMT is 0 but broker is +2. So at 17:00 EST broker time is 00:00. So I need to add 17 +7. Then I need to add the difference in time zones which is -5 from my 0 GMT to EST. So in the end it will end up with +2 Anyway?
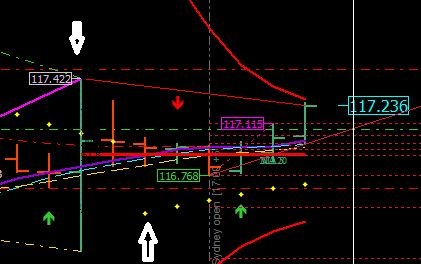
Daily plan 2016.02.07 (at Sydney opening) ROMAR on Daily - down ROMAR on 2H - down ROMAR on 1H down Market is in downtrend 2H chart Opening at 130.19 ROMAR resistance (EMA is below ROMAR) SMOOTH - resistance EMA resistance NOTES All 4 horsemen are downtrend. MACD and PSAR are negative. 1H chart ROMAR resistance (EMA below ROMAR) SMOOTH resistance (Purple below SMOOTH) EMA - resistance NOTES Market starts turning up. PURPLE has crossed WHITE and is very near SMOOTH. PSAR and MACD still negative. Daily chart ROMAR resistance (EMA below ROMAR) SMOOTH...