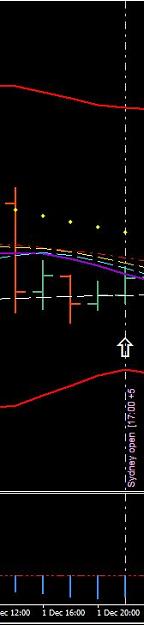
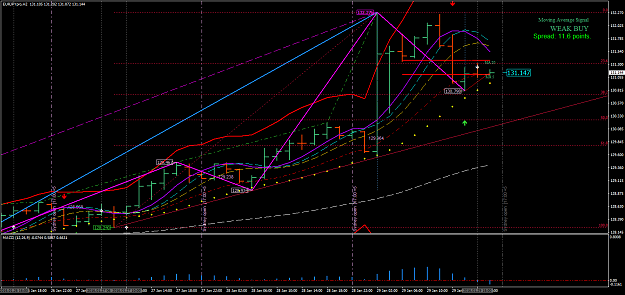
Disliked{quote} Hi all, anyone could help here? one the one hour chart, Dove wrote 1 HOUR CHART: ROMAR: Support EMA: Support Parabolic: Resistance On the open candle at 17:00 (big white arrow) I see ROMAR; EMA also as Resistance, because they are on top of the candle? Do I miss something, could you please help? Thank's a lot.Ignored
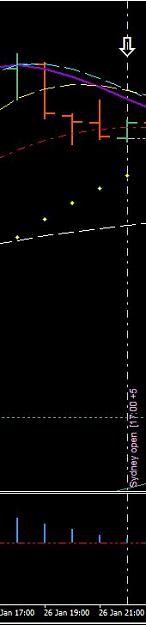
ROMAR is below EMA for the Up so they are supports even if the bar is below them..you have to understand that with this system you're not looking at candles but at the relationship of indicators with each other. That's the objective.