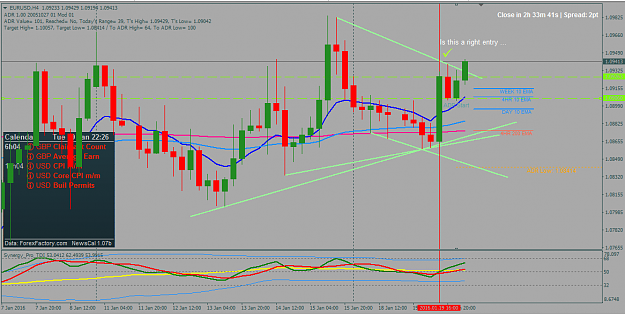
 Another simple system - Time-Frame 15
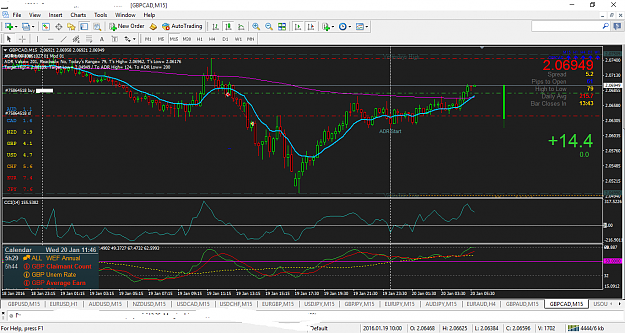
![Click to Enlarge
Name: 2016-01-18 17_48_56-6747683_ FxPro.com-Demo01 - Compte Démo - [GBPUSD,M15].png
Size: 66 KB](/attachment/image/1833196/thumbnail?d=1453139434)
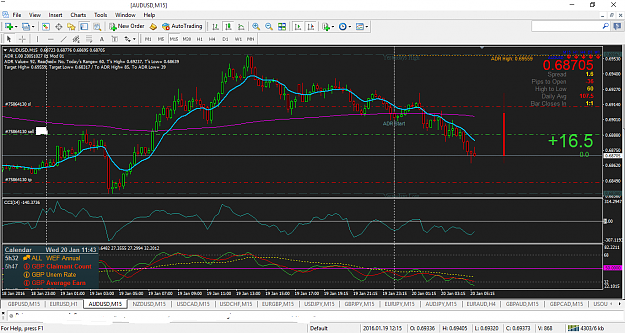
![Click to Enlarge
Name: 2016-01-18 17_52_35-6747683_ FxPro.com-Demo01 - Compte Démo - [AUDUSD,M15].png
Size: 73 KB](/attachment/image/1833198/thumbnail?d=1453139630)
- #26,570
- Jan 19, 2016 6:25am Jan 19, 2016 6:25am
- Joined Aug 2012 | Status: Trader | 18,655 Posts
the cautious seldom err....C
- #26,571
- Jan 19, 2016 6:37am Jan 19, 2016 6:37am
- Joined Aug 2012 | Status: Trader | 18,655 Posts
the cautious seldom err....C
- #26,576
- Jan 19, 2016 10:42am Jan 19, 2016 10:42am
- Joined Aug 2012 | Status: Trader | 18,655 Posts
the cautious seldom err....C
- #26,579
- Jan 19, 2016 9:39pm Jan 19, 2016 9:39pm
- Joined Aug 2012 | Status: Trader | 18,655 Posts
the cautious seldom err....C
- #26,580
- Jan 19, 2016 9:51pm Jan 19, 2016 9:51pm
- Joined Aug 2012 | Status: Trader | 18,655 Posts
the cautious seldom err....C