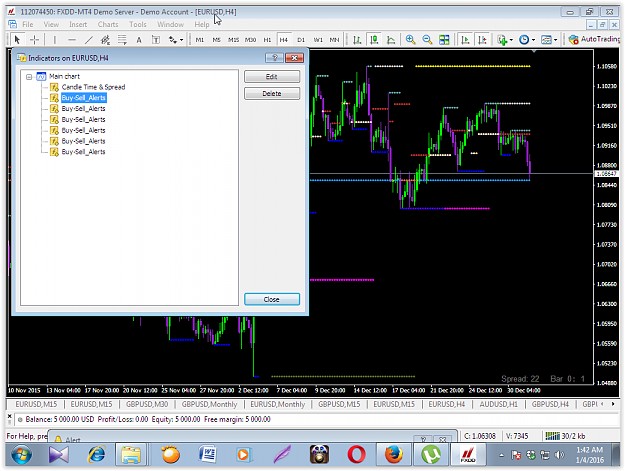
I CAN'T CODE SO I SHARE MY IDEA /VIEW HERE .......Any great master coder interested to create attached img type sup res indicator .i just change color and time frame like mn/wk/day/4h/1h/15m..then it becomes something cool beautiful .when 2/3 time frame sup/res same level/confluence then it mix color ...look sup res zone 2/3 color .may be it is already here and there but i did not find.i used 1 indicator 6 time and 12 diff color for sup/res to see mix/confluence.it is difficult to memorize color or time frame .my humble request please if it is possible make one indicator include if i touch mouse at color it show time frame .so i can see how many time frame confluence. ANY QUESTIONS ASK ME.THANKS IN ADVANCE.
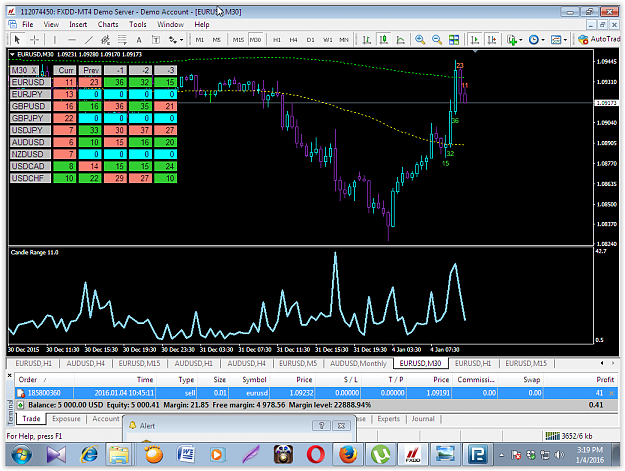
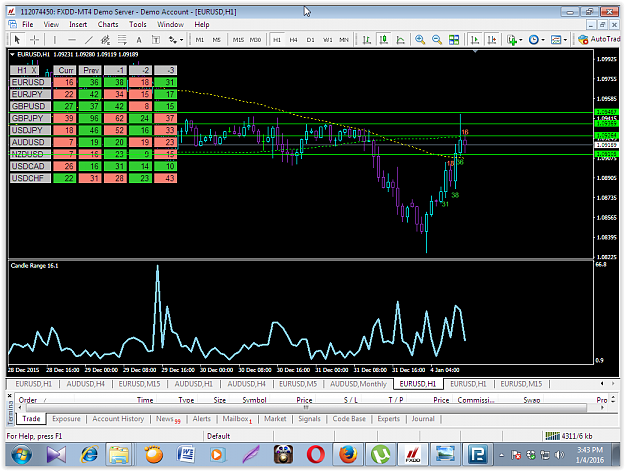
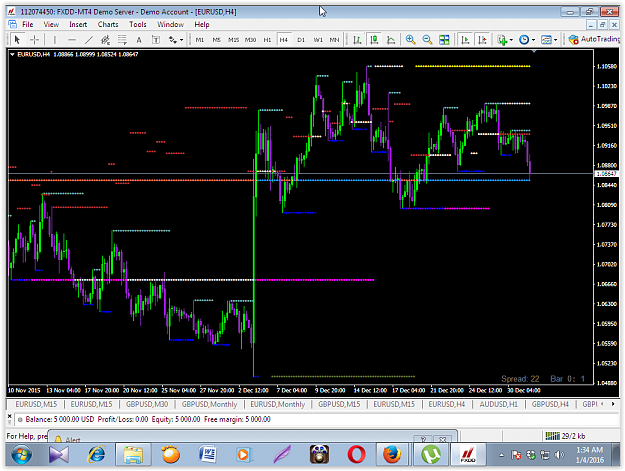
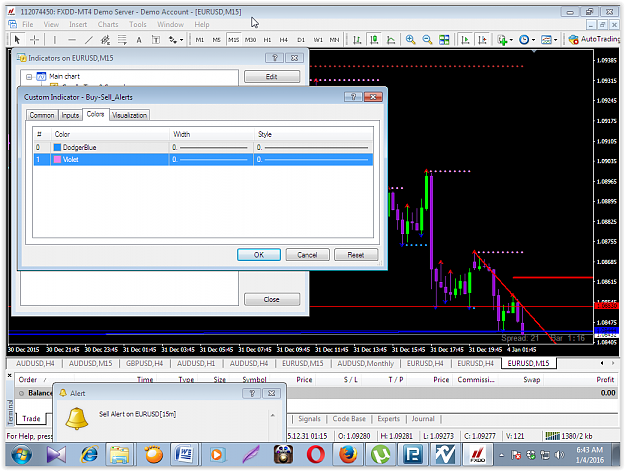
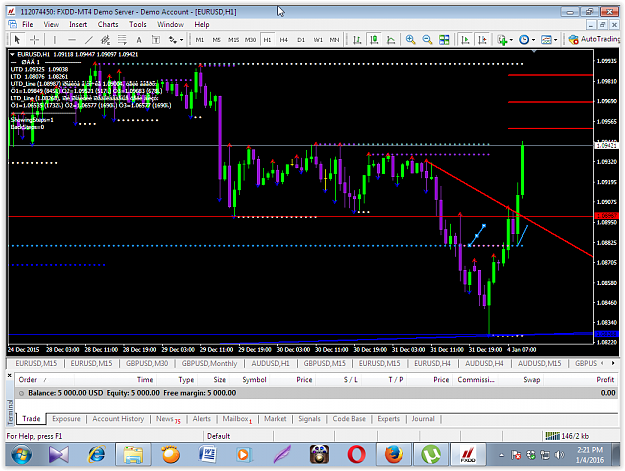
look live market 1st chart 15 m viloate /sup break (price down)then 2nd image dodger blue/res break(price go up)and i am watching 1 hour chart look violate and dodger blue color mix ..so i can visualize sup+res in one line/zone .may be it has no value to others but i think it is some thing beautiful and unique
look live market 1st chart 15 m viloate /sup break (price down)then 2nd image dodger blue/res break(price go up)and i am watching 1 hour chart look violate and dodger blue color mix ..so i can visualize sup+res in one line/zone .may be it has no value to others but i think it is some thing beautiful and unique
Attached Image(s) (click to enlarge)
Say something meaningful or Silence!!