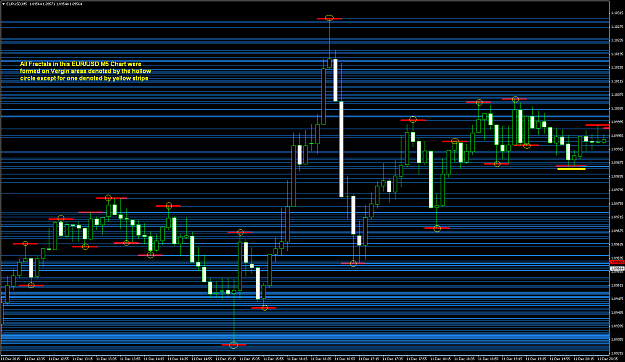
During the development of an EA that is supposed to trade S/R lines based on previous Highs and Lows I noticed a strange thing.
The EA is using an indicator I developed (attached), where the indicator identifies and plots historical fractals (high/lows) as S/R lines on the chart extending in the future, where the depth can be controlled via Fractal Depth input.
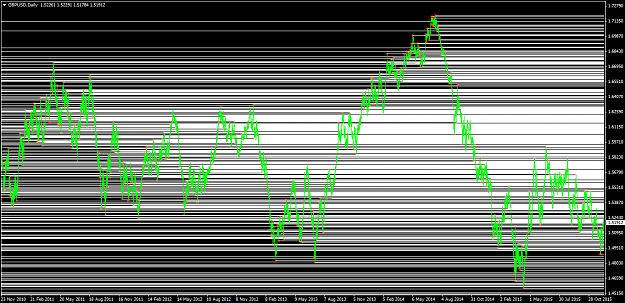
In the image below GPB/USD Daily (max zoom out) , the indicator was set to depth of 3 (minimum), and 2000 historical bars (almost 8 years).
The white lines are the assumed S/R lines. You will notice that in specif price areas of the chart those lines are very adjacent to each other and filling the price space.
I saw that price is so keen to make NEW highs and lows so it bypasses those known (washed-up) S/R areas
to a virgin area which does not have S/R lines yet.
What do you think ?
The EA is using an indicator I developed (attached), where the indicator identifies and plots historical fractals (high/lows) as S/R lines on the chart extending in the future, where the depth can be controlled via Fractal Depth input.
In the image below GPB/USD Daily (max zoom out) , the indicator was set to depth of 3 (minimum), and 2000 historical bars (almost 8 years).
The white lines are the assumed S/R lines. You will notice that in specif price areas of the chart those lines are very adjacent to each other and filling the price space.
I saw that price is so keen to make NEW highs and lows so it bypasses those known (washed-up) S/R areas
to a virgin area which does not have S/R lines yet.
Attached Image (click to enlarge)
What do you think ?
Attached File(s)
No guts, no glory