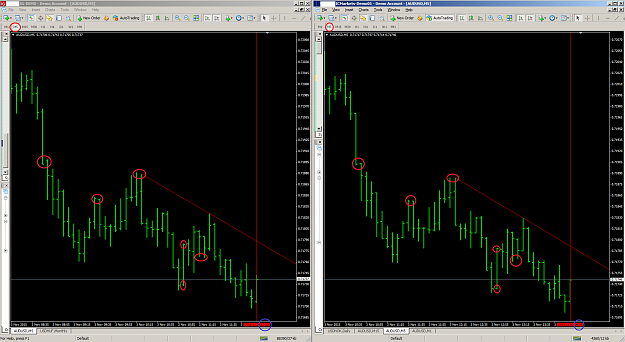
See attached chart. Two major brokers: IC Markets and IG. Both Demo account. Daily charts.
MAJOR differences.
Small trend line breakout on one vs not-even-hit on the other (think about how different a message this gives: potential upcoming breakout vs nowhere-near-breakout!), pinbar vs not, many small candles on IG vs the many large candles on IC Markets...
Rationale 1: don't overly rely on chart events like Trend line crosses, double top accuracy etc.'s - even when it comes to a timeframe as high as Daily. I would instead use an "approximately double top", "approximately TL hit" etc. MAYBE. Give me your thoughts.
Rationale 2: if you're going to be coding an EA or anyting else, you'd better make sure that you use data from your broker (or better yet, back scan data live)
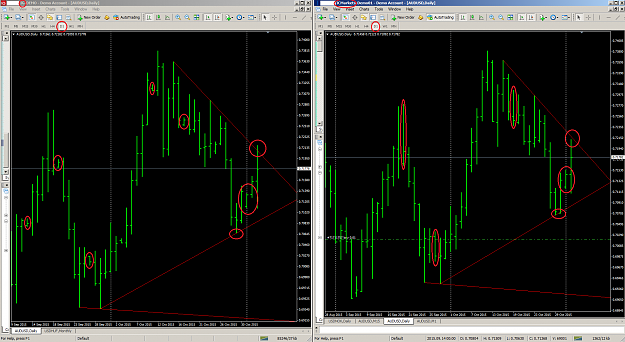
Attached Image (click to enlarge)
Not financial advice. For testing purposes only. Do not use on live account