• Home
  • Forums
  • Trades
  • News
  • Calendar
  • Market
  • Brokers
  • Login
  • Join
  • 3:16am
Menu
  • Forums
  • Trades
  • News
  • Calendar
  • Market
  • Brokers
  • Login
  • Join
  • 3:16am
Sister Sites
  • Metals Mine
  • Energy EXCH
  • Crypto Craft

Options

Bookmark Thread

First Page First Unread Last Page Last Post

Print Thread

Similar Threads

Great EA, I just need a bit of help 116 replies

Anyone running MT on Windows 7 64 bit? 19 replies

seeking advice for next steps... a bit lost 9 replies

Does anyone feels the same way? Need Advice.... 16 replies

Free Advice - Any EURUSD Trade 4 replies

  • Trading Discussion
  • /
  • Reply to Thread
  • Subscribe
  • 7
Attachments: Just a bit of advice, for anyone, for free
Exit Attachments
Tags: Just a bit of advice, for anyone, for free
Cancel

Just a bit of advice, for anyone, for free

  • Last Post
  •  
  • 1 3456Page 7 8
  • 1 56Page 7 8
  •  
  • Post #121
  • Quote
  • Oct 12, 2015 2:03pm Oct 12, 2015 2:03pm
  •  j4d
  • Joined Jan 2009 | Status: Learning life... | 8,341 Posts
Quoting triphop
Disliked
{quote} Deep breaths mate, deep breaths. Even if Ray Dalio opened his own thread here, you'd instantly get one twonk telling him he doesn't know how the financial world works. Another would pop up and say he's a statistical anomaly, while a third would try and sell him some EA they made in their grandma's attic for a couple of mill.
Ignored

Lmao.... true..
Memories caught in time but never forgotten
 
 
  • Post #122
  • Quote
  • Oct 12, 2015 9:31pm Oct 12, 2015 9:31pm
  •  Copernicus
  • | Commercial Member | Joined Apr 2013 | 4,363 Posts
Quoting the redlion
Disliked
I guess my take on the market is guess extremes, extrapolate drift, and use the charts to attempt to get a favorable price at best as the market will move randomly in infinite number of directions and the hope is to have a weak tendency towards fundamentals long term. I am mostly focused on Risk Management as of late. what is your take?
Ignored
That perspective is just so appropriate IMO on so many levels and is exactly the way I view things as well but I recognise my deficiencies in FA. Thanks for the statistical detail and examples

With a similar philosophy I look at a price chart over an extended sample set, define if there is any possible bias in the sample and it's direction. I then place an entry trap in the projected direction of that existing bias that is well beyond ATR which forces future price to stretch towards that predictive entry for me to get triggerred or otherwise simply avoid the current noise (unpredictable detail of the price pattern). If it does stretch to that entry in tandem with historic price directionality then this is treated as a potential anomalous price move that perhaps is not a random feature and is driven by perhaps some underying fundamental factor or market failure condition. Hopefully these conditions exist for an extended duration and to capture the move for as long as possible I simply place a trailing stop distally beyond the noise (ATR) of recent price movement and cross my fingers that it is a non-random extended momentum bias move in otherwise unpredictable price movement.

If I do this often enough by risking only a smidge of my limited trade capital, then I possibly may catch a fundamental non-random bias in price directionality. I accept that in the very long term, fundamental drivers ultimately are dominantly responsible for determining fair value and driving price. That is why there are investors and that is why we have economic market intervention practices. If in the long term price is driven from a lower/higher point A to a higher/lower point B for rationale reason, then:

  1. the 'robust' simple trading strategy that is less constraining and allows the trajectory freedom of movement but can be in the market for a longer duration hence participate in all available progressive moves taken in the overall direction of bias by that instrument. This would be a preference for the FA out there who may be clear on the future outcome but unsure as to the timing..... but unconstrained flexibility can lead to significant drawdowns (an opportunity cost) from a series of unfavourable moves that can tie up available trade capital and stimy participation in other opportunities. Given the deeper pockets required and the level of analysis needed to identify opportunities this strategy is therefore typically more selective in nature, only focussing on a handful of opportunities with FA future potential (ranks potential and selects those offerring highest potential in accordance with their analysis) which in turn creates aditional risk in the selection method itself because.... what if your analysis is simply wrong?: or
  2. the trading strategy that is more prescriptive in nature and switched on and off when certain conditions arise.... only responding to directional price moves that are in concordance with historic price bias but within strict price risk parameters to mercilessly protect capital if your prescriptive viewpoint is wrong. This appeals to trend traders who simply use TA to guage future price direction and who participate in any available opportunity as they do not have a FA fundamental stance about the future and thus apply the principle that at times, these rare price moves just happen and you just need to be around to participate in them. Strict risk management is essential to gain diversification with finite capital across the investment universe and thereby increase the probability event of a sustained directional price move in any potential instrument .....but the risk for the trend trader is that the underlying assumption that 'price sometimes moves in an extended directional way' might never eventuate to sufficient levels to pay for the mistakes.


So IMO somewhere between these two schools of thought there clearly lies a happy medium and an optimal combination but to achieve this outcome you need 'analytical muscle' and a diverse skill set that is rarely found in a single trader. That is where a 'team' of experts come in and where the retail space is severely lacking. :-(


  • Post #123
  • Quote
  • Oct 13, 2015 1:12am Oct 13, 2015 1:12am
  •  the redlion
  • Joined Jan 2011 | Status: Member | 2,680 Posts
Copernicus: yeah I agree, it is not as easy as everyone here purports it to be, Everyone FF is profitable...Haven't you noticed?

Here some further points...if the data is random akin to a coin flip with 50% probability then in the long term we will all blow up, because as the gambler's ruin problem states that the player with the most capital wins in a game of coin flips (with a fair coin) # p2= n1/(n1+n2) , P1= n2/(n1+n2)

Retail traders with limited capitals lose in this scenario, FA, TA will have no impact in the market as price has no memory.

Before, I said that my assumption was drift ....drift= directional bias a random series does not have directional bias so to make this assumption we can estimate the Hurst exponent E[R(n)/S(n)]= Cn^H as N --> ∞

using data from Eur/Usd since inception on the Monthly studies

> hurstexp(eurusd.hourly.log)
Simple R/S Hurst estimation: 0.5362771
Corrected R over S Hurst exponent: 0.5759688
Empirical Hurst exponent: 0.5427047
Corrected empirical Hurst exponent: 0.5491624
Theoretical Hurst exponent: 0.5293392

> hurstexp(eurusd.log)
Simple R/S Hurst estimation: 0.5535778
Corrected R over S Hurst exponent: 0.6041224
Empirical Hurst exponent: 0.5901369
Corrected empirical Hurst exponent: 0.54934
Theoretical Hurst exponent: 0.539944

> hurstexp(eurusd.weekly.log)
Simple R/S Hurst estimation: 0.5645061
Corrected R over S Hurst exponent: 0.5977741
Empirical Hurst exponent: 0.5849529
Corrected empirical Hurst exponent: 0.5454871
Theoretical Hurst exponent: 0.539944

> hurstexp(eurusd.monthly.log)
Simple R/S Hurst estimation: 0.5704515
Corrected R over S Hurst exponent: 0.6453221
Empirical Hurst exponent: 0.8021816
Corrected empirical Hurst exponent: 0.7458711
Theoretical Hurst exponent: 0.5442385

as you can see the Monthly chart shows the biggest predictability and shows the data has underlying trend component,

"value of H=0.5 can indicate a completely uncorrelated series, but in fact it is the value applicable to series for which the autocorrelations at small time lags can be positive or negative but where the absolute values of the autocorrelations decay exponentially quickly to zero. This in contrast to the typically power law decay for the 0.5 < H < 1 and 0 < H < 0.5 cases." ---wiki pedia

their definition is good enough.
edit: a data of 0<H<.5 indicates mean reversion
a data of .5<H<1 indicates trend
AVT INVENIAM VIAM AVT FACIAM
 
 
  • Post #124
  • Quote
  • Oct 13, 2015 1:42am Oct 13, 2015 1:42am
  •  Copernicus
  • | Commercial Member | Joined Apr 2013 | 4,363 Posts
Quoting the redlion
Disliked
Copernicus: yeah I agree,
Ignored
Red....you are a scholar and a gentleman. It is this sort of info that is invaluable to me in driving home my opinion about this market and providing the necessary rigurous support for these assumptions.

Your findings are actually embedded in my strategies so this adds significant confidence to my assumptions which I have solidly back-tested over extended time series and market conditions over a diverse range of liquid instruments. Your statistical findings add an extra layer of confidence to them. You are a legend and I greatly appreciate it!!

C
 
 
  • Post #125
  • Quote
  • Oct 13, 2015 3:25am Oct 13, 2015 3:25am
  •  PipMeUp
  • Joined Aug 2011 | Status: Member | 1,325 Posts
Quote
Disliked
a data of 0<H<.5 indicates mean reversion
a data of .5<H<1 indicates trend
Be careful with this simplification guys. H>0.5 means that the probability of the color of a bar to be the same as the previous is above 50%. Note how an idealized text book range fits this definition: the change of color is only at the turning points. Yet it may be mean reverting as well.
No greed. No fear. Just maths.
 
 
  • Post #126
  • Quote
  • Oct 13, 2015 4:16am Oct 13, 2015 4:16am
  •  the redlion
  • Joined Jan 2011 | Status: Member | 2,680 Posts
Quoting PipMeUp
Disliked
{quote} Be careful with this simplification guys. H>0.5 means that the probability of the color of a bar to be the same as the previous is above 50%. Note how an idealized text book range fits this definition: the change of color is only at the turning points. Yet it may be mean reverting as well.
Ignored
I don't think that is the implication at all. Please read about Hurst exponent, all it means is that time series has an underlying tendency which is estimated by such exponent. The implication is that the Eur/Usd is not a random walk, there is empirical evidence of underlying trend although the series show no auto correlation. in simpler terms the Data is random like but not exactly which makes it possible to profit.

a random data is impossible to profit from ... that is the implication.
AVT INVENIAM VIAM AVT FACIAM
 
 
  • Post #127
  • Quote
  • Oct 13, 2015 4:34am Oct 13, 2015 4:34am
  •  the redlion
  • Joined Jan 2011 | Status: Member | 2,680 Posts
Quoting the redlion
Disliked
{quote} I don't think that is the implication at all. Please read about Hurst exponent, all it means is that time series has an underlying tendency which is estimated by such exponent. The implication is that the Eur/Usd is not a random walk, there is empirical evidence of underlying trend although the series show no auto correlation. in simpler terms the Data is random like but not exactly which makes it possible to profit. a random data is impossible to profit from ... that is the implication.
Ignored
Let me illustrate my point further... I converted the Eur/Usd Daily log returns since July 2011 into a binary data to simplify my hypothesis.

[1] 0 1 0 0 0 1 1 0 1 0 1 0 1 1 0 1 1 0 1 0 0 0 1 0 0 1 0 0 1 1 1 0 1 1 1 0 1 0 0 1
[41] 0 1 0 1 0 1 0 0 0 0 1 1 1 1 1 1 1 0 1 0 1 0 1 0 1 1 0 1 0 0 1 1 1 1 0 0 1 1 0 0
[81] 0 1 0 0 0 0 1 1 0 1 1 0 1 1 0 1 1 0 1 1 0 1 0 0 0 1 0 0 0 0 0 0 0 0 0 0 1 1 0 0
[121] 0 0 1 0 0 0 1 1 0 1 0 0 0 1 1 1 1 0 1 1 0 1 0 0 0 0 1 0 1 0 0 0 1 0 0 0 1 1 1 0
[161] 0 0 0 0 1 1 1 0 1 0 0 1 1 0 0 0 0 1 0 0 1 0 1 1 1 1 0 0 1 0 0 1 1 0 1 1 1 0 1 1
[201] 1 1 0 0 1 0 1 0 0 0 1 0 1 1 1 1 1 0 0 1 1 1 1 1 1 0 0 1 0 0 0 1 0 1 1 0 0 0 1 0
[241] 0 0 0 1 1 1 0 1 1 1 1 1 1 0 1 1 1 1 1 0 0 0 1 1 1 1 1 0 1 0 1 0 1 1 1 0 0 1 0 0
[281] 1 1 0 0 1 1 1 0 0 1 0 0 1 0 1 1 0 1 1 1 1 0 1 0 0 0 1 1 0 0 1 0 1 0 0 0 0 1 1 0
[321] 0 1 1 0 1 0 1 0 0 1 1 0 0 1 0 1 0 1 0 1 1 1 0 1 1 1 1 1 0 1 0 0 1 0 1 0 1 0 1 0
[361] 1 1 1 1 0 1 0 1 1 0 0 0 0 0 1 0 1 1 0 1 1 0 1 1 0 1 1 1 1 0 1 1 1 1 0 1 1 0 0 0
[401] 1 0 0 1 0 1 0 1 0 0 1 0 1 0 0 0 1 0 0 1 1 1 0 1 1 0 1 1 0 1 0 1 1 1 0 0 0 0 1 0
[441] 1 1 0 1 1 0 1 0 0 0 0 0 1 0 1 1 1 1 0 0 1 1 1 1 0 0 0 1 0 1 1 0 1 1 0 1 1 0 1 1
[481] 1 0 1 1 0 0 1 1 1 1 0 0 0 0 0 1 0 1 0 0 1 1 1 0 1 1 1 0 1 1 0 1 1 1 0 0 1 0 1 1
[521] 1 1 1 0 0 1 1 0 0 1 1 0 1 1 1 0 1 0 0 1 0 0 1 1 0 0 0 1 0 1 1 0 1 0 0 0 1 0 0 1
[561] 0 1 1 1 1 0 0 1 1 1 1 0 0 1 0 1 0 1 1 0 1 0 1 1 1 0 1 0 1 1 1 0 0 1 1 0 0 0 1 1
[601] 1 0 0 0 1 1 1 1 0 0 0 1 0 0 0 1 1 1 1 1 0 1 1 0 1 1 0 0 0 0 0 1 0 0 1 0 0 0 0 1
[641] 0 0 1 1 0 1 0 1 0 0 0 0 1 0 1 0 1 1 0 1 1 1 0 1 1 0 0 0 0 1 1 1 0 1 1 0 0 0 1 0
[681] 0 0 1 0 1 0 0 0 1 0 0 1 0 1 0 0 1 0 1 0 0 0 1 0 0 0 1 0 0 0 1 1 0 1 0 1 0 1 1 0
[721] 1 0 1 0 1 0 0 0 0 1 0 0 1 0 1 1 1 0 0 1 0 1 0 0 1 0 0 1 1 1 1 0 0 0 0 1 0 0 1 0
[761] 1 0 1 1 0 1 1 1 0 1 1 1 0 0 1 0 0 1 0 1 1 1 0 1 0 1 0 0 0 0 0 1 1 0 0 1 0 0 0 0
[801] 0 0 0 1 0 0 1 0 0 1 0 1 0 0 1 1 0 1 0 1 1 0 1 0 1 0 0 1 0 0 1 0 0 1 0 1 1 0 0 0
[841] 1 0 0 0 0 0 0 1 0 1 1 1 0 1 1 0 1 0 1 0 0 1 1 1 0 0 0 0 0 0 1 1 1 1 0 0 0 1 1 1
[881] 1 1 1 0 0 1 1 0 0 0 1 1 1 1 0 0 0 1 0 0 0 1 1 1 0 1 1 0 0 1 1 1 0 1 1 0 1 1 0 0
[921] 0 1 0 0 1 0 0 1 1 0 0 1 0 1 0 1 0 0 0 1 1 0 1 0 1 0 0 0 1 0 0 1 1 1 1 1 1 1 0 0
[961] 0 1 1 1 1 0 0 0 0 1 1 0 0 1 1 1 1 1 1 0 0 1 1 0 0 0 1 0 1 1 1 0 1 1 0 1 0 1 1

50.25025% of the time the euro has closed above open. It looks like a random coin toss experiment (the implication we cannot profit due to gambler's ruin problem)

Autocorrelations of series ‘eurusd.log’, by lag
0 1 2 3 4 5 6 7 8 9 10 11
1.000 -0.035 0.037 -0.015 -0.024 0.038 -0.049 0.026 -0.015 0.032 -0.091 0.064
12 13 14 15 16 17 18 19 20 21 22 23
0.047 -0.052 -0.005 -0.097 -0.025 0.001 -0.023 0.067 -0.024 0.018 0.019 -0.003
24 25 26 27 28 29
0.024 0.041 0.006 -0.030 0.017 -0.017

according to the this auto correlation the data is random ( again we cannot profit)

however......

> hurstexp(eurusd.monthly.log)
Simple R/S Hurst estimation: 0.5704515
Corrected R over S Hurst exponent: 0.6453221
Empirical Hurst exponent: 0.8021816
Corrected empirical Hurst exponent: 0.7458711
Theoretical Hurst exponent: 0.5442385

according to the estimation of the Hurst Exponent there is an underlying tendency to this time series... and that is H>.50 which implies the data has an underlying trend component as opposed to H=0 completely random (we cannot profit) or H<.0 mean reverting the implication for underlying trend is not that the last bar will indicate >50% that the next bar will be the same but that there is a tendency for the market to have a certain bias... that is all. if the Hurst would be H<50% then there would be a bias towards mean reversion or bias towards a negative correlation.
AVT INVENIAM VIAM AVT FACIAM
 
 
  • Post #128
  • Quote
  • Oct 13, 2015 5:36am Oct 13, 2015 5:36am
  •  PipMeUp
  • Joined Aug 2011 | Status: Member | 1,325 Posts
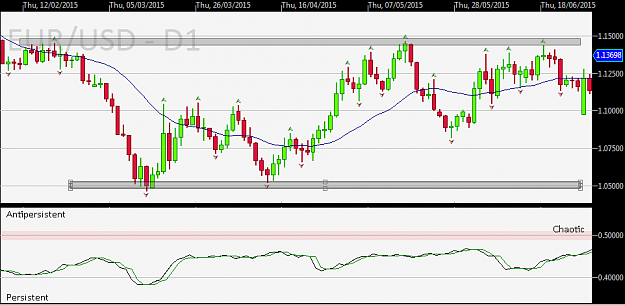
I read a lot about Hurst exponent. The probabilitic view a valid. It's not coming from me. Cherry pick a few of nice looking ranging periods and you'll see that H>0.5 for most of them.

I also searched about estimators of its value. The best for us is also the simplest: R/S. It is the one that accomodates the most with non normality and the one which requires the less data. Only 10000 samples are usually enough. Your sample size < 1000 is too small for acurate estimation. Just look at your results they vary from 0.5442385 to 0.8021816 depending on the method.

I found the variation index by Dubovikov & Starchenko [2004] is a good proxy for H (it is <0.5 when H>0.5 a.v.v):
Attached Image (click to enlarge)
Click to Enlarge

Name: EURUSD-D1.png
Size: 18 KB


[2004] Dubovikov & Starchenko. Dimension of the Minimal Cover and Local Analysis of Fractal Time Series
No greed. No fear. Just maths.
 
 
  • Post #129
  • Quote
  • Oct 13, 2015 6:46am Oct 13, 2015 6:46am
  •  FXEZ
  • Joined Jan 2007 | Status: developing... | 972 Posts
Interesting discussion guys!

This article describes a simple way to interpret Hurst. Where 0.5 is Brownian motion or a random walk and below indicates anti-persistence and above indicates persistence. It seems to me that a number very close to zero would be easier to deal with from a trading strategy standpoint than a number close to 1, as shown in the two examples on that blog between a Hurst of 0.043 and 0.95:

http://www.analytics-magazine.org/ju...of-time-series

PipMeUp, thanks for the citation. It sounds like your'e interpreting Hurst in a similar manner to the common interpretation of autocorrelation. Is that correct?
 
 
  • Post #130
  • Quote
  • Oct 13, 2015 7:26am Oct 13, 2015 7:26am
  •  Copernicus
  • | Commercial Member | Joined Apr 2013 | 4,363 Posts
Quoting FXEZ
Disliked
Interesting discussion guys! This article describes a simple way to interpret Hurst. Where 0.5 is Brownian motion or a random walk and below indicates anti-persistence and above indicates persistence. It seems to me that a number very close to zero would be easier to deal with from a trading strategy standpoint than a number close to 1, as shown in the two examples on that blog between a Hurst of 0.043 and 0.95: http://www.analytics-magazine.org/ju...of-time-series PipMeUp, thanks for...
Ignored
Thanks for the article FXEZ. The Hurst exponent has wide application and makes sense even to a dumb *&^% like me. The rescaling aspect on smaller timeframe chunks is an intuitively appealing approach for fractal formations :-)
 
 
  • Post #131
  • Quote
  • Oct 13, 2015 7:50am Oct 13, 2015 7:50am
  •  Gbg86
  • | Joined Oct 2015 | Status: Purity of thoughts | 24 Posts
Hi, Katrooo.

It's interesting to read your opinion. There are moments where I agree with you. There are moments that are controversial. Such as item 7.
How about Scalping strategy? These strategies show a good profit. Here a trader takes an average of 1-10 pips. I have at least a few friends, that increase of 100% deposit for 1 day using scalping. Shouldn't be underestimated the mini timeframes.
 
 
  • Post #132
  • Quote
  • Edited 8:58am Oct 13, 2015 8:44am | Edited 8:58am
  •  PipMeUp
  • Joined Aug 2011 | Status: Member | 1,325 Posts
Quoting FXEZ
Disliked
It sounds like your'e interpreting Hurst in a similar manner to the common interpretation of autocorrelation. Is that correct?
Ignored
On the link you posted the author says:
- In an anti-persistent time series (also known as a mean-reverting series) an increase will most likely be followed by a decrease or vice-versa.
- In a persistent time series an increase in values will most likely be followed by an increase in the short term and a decrease in values will most likely be followed by another decrease in the short term.

I don't know if you can map H to the parameter of an AR(1) process. The analogy is certainly wrong when H is far from 0.5.


EDIT: I just found this about the fractal dimension vs Hurst exp.
http://mathoverflow.net/questions/14...hurst-exponent
http://arxiv.org/abs/physics/0109031
No greed. No fear. Just maths.
 
 
  • Post #133
  • Quote
  • Oct 13, 2015 9:23am Oct 13, 2015 9:23am
  •  FXEZ
  • Joined Jan 2007 | Status: developing... | 972 Posts
Quoting PipMeUp
Disliked
{quote} On the link you posted the author says: - In an anti-persistent time series (also known as a mean-reverting series) an increase will most likely be followed by a decrease or vice-versa. - In a persistent time series an increase in values will most likely be followed by an increase in the short term and a decrease in values will most likely be followed by another decrease in the short term. I don't know if you can map H to the parameter of an AR(1) process. The analogy is certainly wrong when H is far from 0.5. EDIT: I just found this about...
Ignored

Thanks for that clarification. I'm still getting my head wrapped around Hurst but the descriptions you quoted from the article do seem quite familiar to how I interpret autocorrelation. The relationship is probably not directly map-able, just in that they are two ways to measure "trend".

I also found that the simple R/S has the lowest variance of the other calculations over time, which would support your assertion that it is the best to use.
 
 
  • Post #134
  • Quote
  • Oct 13, 2015 10:05am Oct 13, 2015 10:05am
  •  Matt098
  • Joined Oct 2015 | Status: Go on | 92 Posts
Quoting katrooo
Disliked
6. I suggest you learn macro & fundamentals & flows picture properly on top of the technicals - doesn't hurt to know what factors are the guys who have a price impact considering when they take trading decisions
Ignored
Hey, there.

I think is possible and necessary to combine fundamental and technical analysis, but one of them should dominate. If we talk about FX market globaly, fundamental analysis without technical doesn't work at all.
But your thoughts are useful for me. There is much to ponder over.
 
 
  • Post #135
  • Quote
  • Oct 13, 2015 10:09am Oct 13, 2015 10:09am
  •  PipMeUp
  • Joined Aug 2011 | Status: Member | 1,325 Posts
That's no my assertion you know. I can't get my hand back on the paper. The guy tested various methods (R/S, wavelet, DFA). His conclusion was that R/S is the most robust and the wavelet is the worse (50K+ samples required, 65536 if you use a diadic size).
No greed. No fear. Just maths.
 
 
  • Post #136
  • Quote
  • Oct 13, 2015 3:27pm Oct 13, 2015 3:27pm
  •  katrooo
  • Joined Apr 2010 | Status: Member | 350 Posts
hey guys,

glad to see this thread being so active, keep it up! some interesting stuff being discussed here, will need to go through it and think about it. Unfortunately the market is keeping me extremely busy these days and didn't even have much time over the weekend so couldn't post. I will really try my best to post / reply this weekend!!
 
 
  • Post #137
  • Quote
  • Oct 15, 2015 9:12am Oct 15, 2015 9:12am
  •  yonnie
  • Joined May 2008 | Status: Member | 1,158 Posts
what a life........10+ hours a day....stressful

does that mean a prop trader like you cant make enough money by only trading longer-term?
 
 
  • Post #138
  • Quote
  • Oct 15, 2015 9:23am Oct 15, 2015 9:23am
  •  hariwewe
  • | Joined Jun 2008 | Status: Member | 86 Posts
Quoting yonnie
Disliked
what a life........10+ hours a day....stressful does that mean a prop trader like you cant make enough money by only trading longer-term?
Ignored

AGREE,,,
 
 
  • Post #139
  • Quote
  • Oct 15, 2015 9:24am Oct 15, 2015 9:24am
  •  hariwewe
  • | Joined Jun 2008 | Status: Member | 86 Posts
Quoting hariwewe
Disliked
{quote} AGREE,,,
Ignored
PEACE
 
 
  • Post #140
  • Quote
  • Oct 19, 2015 7:05am Oct 19, 2015 7:05am
  •  BalenC
  • | Joined Oct 2015 | Status: Member | 16 Posts
Quoting katrooo
Disliked
4. Stop looking for this one system, robot, holy grail. Traders in general fall into this pursuit (as myself in the past) as they want to have a method which doesn't require them to THINK - this doesn't exist though. You have to treat it as a business, do your analysis, do your homework, think a lot, plan everything ahead, risk manage everything, manage your emotions and every trade continuosly, be open minded all the time and many other factors around. Markets are constantly changing and you have to adapt if you want to succeed. To do all these...
Ignored
Hi, Katrooo,

In general, I agree, but item 4 a little confused.
I believe that's necessary to find a single trading system and continually improve it.
If you use different trading systems, for example, first trading following the breakdown, then on reflection, etc., so no one strategy won't work.
 
 
  • Trading Discussion
  • /
  • Just a bit of advice, for anyone, for free
  • Reply to Thread
    • 1 3456Page 7 8
    • 1 56Page 7 8
0 traders viewing now
  • More
Top of Page
  • Facebook
  • Twitter
About FF
  • Mission
  • Products
  • User Guide
  • Media Kit
  • Blog
  • Contact
FF Products
  • Forums
  • Trades
  • Calendar
  • News
  • Market
  • Brokers
  • Trade Explorer
FF Website
  • Homepage
  • Search
  • Members
  • Report a Bug
Follow FF
  • Facebook
  • Twitter

FF Sister Sites:

  • Metals Mine
  • Energy EXCH
  • Crypto Craft

Forex Factory® is a brand of Fair Economy, Inc.

Terms of Service / ©2023