Nope. We are hijacked by biggest liers, thiefs, money grabers, and mass murderers. Not morons. Dont underestimate the enemy becouse it isnt so cheap.
Evil=! cheap+easy ; C++.
I'm not ready to short, This structure is not bearish to me.. EU M30 {image}
Ignored
Confused a little.
On one hand we have the target 1350 reached and the close of day seems to be upper than a descending trendline;
On the other hand we have the close below the 245 coral SMA, so I can not say we are already bullish for the full gear;
On the third hand we have your picture and the close is about to be above the upper R/S line;
On the fourth hand, if we look at the weekly chart, we can see a bearish ensign/flag that represent a possibility to go further downwards.
What's happening is shameful to say the very least.
Here's a good one, a bit dry so if you get bored go to
29 minutes where Dr. Roberts puts his thing down.
Regards,
Inserted Video
“According to the Bible, God created the heavens and the Earth. It is man’s prerogative - and woman’s - to create their own particular and private hell.” ― Rod Serling, The Twilight Zone: Complete Stories
If you are new to FX don"t follow my trades, I 've blown many live accounts
What's happening is shameful to say the very least. Here's a good one, a bit dry so if you get bored go to 29 minutes where Dr. Roberts puts his thing down. Regards, https://www.youtube.com/watch?v=bQDKBp8RgNs “According to the Bible, God created the heavens and the Earth. It is man’s prerogative - and woman’s - to create their own particular and private hell.” ― Rod Serling, The Twilight Zone: Complete Stories...
{quote} Confused a little. On one hand we have the target 1350 reached and the close of day seems to be upper than a descending trendline; On the other hand we have the close below the 245 coral SMA, so I can not say we are already bullish for the full gear; On the third hand we have your picture and the close is about to be above the upper R/S line; On the fourth hand, if we look at the weekly chart, we can see a bearish ensign/flag that represent a possibility to go further downwards. SO I am confused. Best...
Ignored
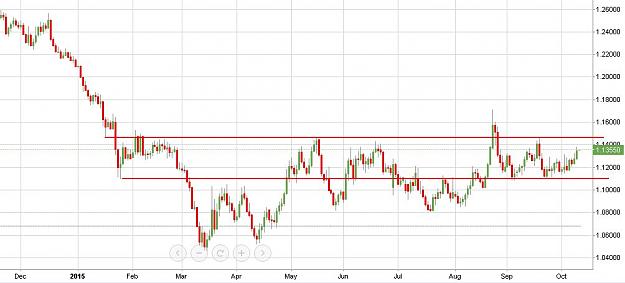
I'm sure you're not the only one who confused with current situation on EU ... me too
Let's take a look Daily chart without indicator,
Attached Image (click to enlarge)
Clearly we are in warzone (between red-lines) that been contested for almost 9 months,
here is my view:
- For mid-term
I think we better trade within that range and not expecting break-out anytime soon until some more clear indications appears,
currently mid-term direction is UP.
- For short-term
Seem we are about to change direction to DOWN.
As for precise level maybe Infy and others can give suggestion in more detail.. Cheers.
{quote} Confused a little. On one hand we have the target 1350 reached and the close of day seems to be upper than a descending trendline; On the other hand we have the close below the 245 coral SMA, so I can not say we are already bullish for the full gear; On the third hand we have your picture and the close is about to be above the upper R/S line; On the fourth hand, if we look at the weekly chart, we can see a bearish ensign/flag that represent a possibility to go further downwards. SO I am confused. Best D.P. {image}
Ignored
Dear Phoenix, I have 139xx and 14,40 as possible targets, from the downswing of 18th september, that they would be in the limits in order to not change the overall downtrend. Maybe we can have a last upshot in that direction. Over 14,60, change everything. Best Regards
{quote} I'm sure you're not the only one who confused with current situation on EU ... me too Let's take a look Daily chart without indicator, {image} Clearly we are in warzone (between red-lines) that been contested for almost 9 months, here is my view: - For mid-term I think we better trade within that range and not expecting break-out anytime soon until some more clear indications appears, currently mid-term direction is UP. - For short-term Seem we are about to change direction to DOWN. As for precise level maybe Infy and others can give...
Ignored
AndrexQ,
I agree on all of your points. Technically they are valid.
But I have a feeling that "Big Boys" might upset our plans.
If we break out the 245 SMA on the daily chart (click to enlarge), we can go even higher, right to the 1600-1650 area.
The strong resistance are is right over there.
{quote} Dear Phoenix, I have 139xx and 14,40 as possible targets, from the downswing of 18th september, that they would be in the limits in order to not change the overall downtrend. Maybe we can have a last upshot in that direction. Over 14,60, change everything. Best Regards
Dear Infinitus and other respected members.. i had posted a free chart from sid's site some time back and am posting it again now coz it seems to be playing out very well. with Us dollar index in a bit of trouble, all other currencies and commodities seems to be bouncing back except yen.
1) chart of long term EU from Sid norris (free chart)
2) my 2 cent interpretation of what could be in store until next year. 1st chart shows a 5 wave completion at 1.1713 marked a wave 1. we are probably on 2nd wave.
3) 2nd chart is my view as it seems to be carving out a zigzag although i am not sure if 2nd wave ended at A and we are at the beginning of a 3rd wave, as a precautionary measure, i am expecting a double abc in this case the first c wave could be at 1.1489 (Fe 100)
4) 3rd chart states that after completion of minor c, we descend for a final C wave down to 1.0870 (Fe 100) or to 1.0482 (Fe 161.8) which might complete wave 2 down. Fe 161.8 is also 85.4 retracement of the 1st wave.
Now, if 2nd wave has completed at A (which is also 50% retracement of wave 1, then we shoot up from here to 1.2363. This scenario is perfect as per Sid's chart coz wave 2 seems to have completed. Anyway let's see what happens. I would appreciate your view and charts as well.
Dear Infinitus and other respected members.. i had posted a free chart from sid's site some time back and am posting it again now coz it seems to be playing out very well. with Us dollar index in a bit of trouble, all other currencies and commodities seems to be bouncing back except yen. 1) chart of long term EU from Sid norris (free chart) 2) my 2 cent interpretation of what could be in store until next year. 1st chart shows a 5 wave completion at 1.1713 marked a wave 1. we are probably on 2nd wave. 3) 2nd chart is my view as it seems to be carving...
Ignored
Ooh!
Thank you, String.
I have just thought to see EWs. However I have been waiting for the EW analysis by Infinitus. I hope he is around .
{quote} Ooh! Thank you String. I have just thought to see EWs. However I have been waithing the EW analysis by Infinitus. I hope he is around . Best, D.P.
Ignored
I am also hoping that he sees this and posts some of his thoughts. Have a great day and a fantastic trading week ahead sir.
Joined Mar 2012
|
Status: turning probability into profit
|1,550 Posts
From different sources I have been finding for news of the U.S. recession coming.
Moreover I must say that such news are appearing very often last days. How do you think why?
On the picture you can see a probability for recession to be. It is taken from Bloomberg.
As to the survey the probability U.S. recession has grown much, the first time for the last 14 months.
[quote=Dr.Phoenix;8534034]From different sources I have been finding for news of the U.S. recession coming. Moreover I must say that such news are appearing very often last days. How do you think why? On the picture you can see a probability for recession to be. It is taken from Bloomberg. As to the survey the probability U.S. recession has grown much, the first time for the last 14 months. The second is that you can look at US Recession Watch: The Inventory Liquidation Looms at Zerohedge. The analytics also confirms the U.S. macroeconomics difficulties. Best D.P. {image}[/quote
From different sources I have been finding for news of the U.S. recession coming. Moreover I must say that such news are appearing very often last days. How do you think why? On the picture you can see a probability for recession to be. It is taken from Bloomberg. As to the survey the probability U.S. recession has grown much, the first time for the last 14 months. The second is that you can look at US Recession Watch: The Inventory
{quote} AndrexQ, I agree on all of your points. Technically they are valid. But I have a feeling that "Big Boys" might upset our plans. If we break out the 245 SMA on the daily chart (click to enlarge), we can go even higher, right to the 1600-1650 area. The strong resistance are is right over there. Magenta lines are of MIDAS's. {quote} Yep, they seem to be met your weeshes. Best D.P. {image}
Ignored
Yes it possible..
Well, if this thing really want to go to 1600 or higher then we should see some indications of it within 1440 - 1500 area... so let's wait & see what happen there.
What's happening is shameful to say the very least. Here's a good one, a bit dry so if you get bored go to 29 minutes where Dr. Roberts puts his thing down. Regards, https://www.youtube.com/watch?v=bQDKBp8RgNs “According to the Bible, God created the heavens and the Earth. It is man’s prerogative - and woman’s - to create their own particular and private hell.” ― Rod Serling, The Twilight Zone: Complete Stories...
Dear Infinitus and other respected members.. i had posted a free chart from sid's site some time back and am posting it again now coz it seems to be playing out very well. with Us dollar index in a bit of trouble, all other currencies and commodities seems to be bouncing back except yen. 1) chart of long term EU from Sid norris (free chart) 2) my 2 cent interpretation of what could be in store until next year. 1st chart shows a 5 wave completion at 1.1713 marked a wave 1. we are probably on 2nd wave. 3) 2nd chart is my view as it seems to be carving...
Ignored
Hi String,
sorry for answering late. I am in the French Alps and have only poor connection to the Internet.
I do respect Sid very much. But I am not a friend of counting weekly or mothly charts. Sometimes you can see me doing the same. When doing so it is important to check that count on lower TF. Only when the waves at the smaller TF give confirmation the count on monthly/weekly may be right. Small TF dictate the bigger TF. Since EW is a reflection of social mood, and social mood can turn on a dime, we have to ask the small TF for confirmation.
In this shown case of the EU, Sid tries to count the move up from the 1.04 low as bigger impulse.
Problem with this is: when you look at smaller TF, you will notice a lot of overlapping structures (which get lost in high TF's like weekly). There is no way a chance to count the movements since 1.04 impulsive.
For me the question is mainly:
is the above shown count from EWI right, or are we in a wave 4 sideways action since 1.04 (and maybe already in the wave 5 down)?
Sentiment analysis now shows 69% Euro bulls and only 22% UDX bulls. OK, we are not at extremes yet, and looking at the positioning data of the retail broker outlets one can see, that the EU bears have not given up yet. So we may see more wide swinging sideways action for some days/weeks.
Back to Sid's chart:
if this would be true, we would have had developed a leading diagonal up (wave 1 wave 4 overlap). The wave 2 after a leading diagonal will retrace very deep normally (80-90%). So in this case we may also see prices well below 1.10 sooner or later.
When above shown count from EWI is right, where we are now in a larger wave B, then I think EWI will be wrong in assuming that price will go lower from here for wave C. I think chances would be higher for much more sideways, or price could go down from here to form a wave B of B, and later then up for an impulsive wave C of B.
When EWI thinks, that the USD index is in the beginning of a wave 5 of an impulse, it (maybe) would make more sense in assuming, that the Single Currency is also forming a wave 5 of an impulse down (that would be my main count).
All in all the situation / structure in EU is not very clear from the 1.60 high years ago. So literally all kind of things can happen.