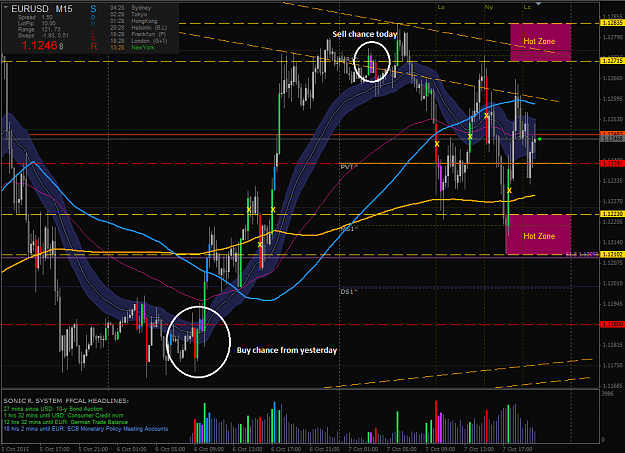
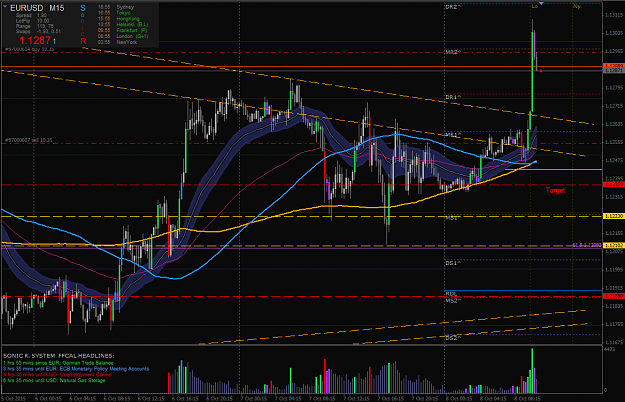
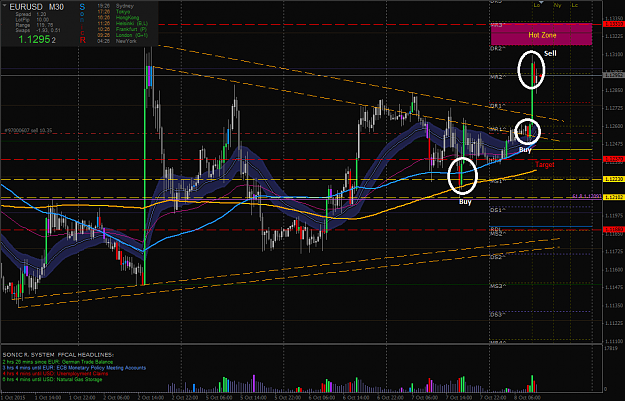
On EURUSD we are still inside the huge 15 minute candle and triangle gets narrower. Today was actually some sort of a choppy day, let me explain why:
If you look at the image you will see that we had actually a buy signal yesterday which I took at the beginning but quitted way too early (Lesson I learned here: don't quit unless you see candles closing below dragon or a candle pair pattern that would signal the opposite)
Then we had a sell signal this early morning purple after green candle pair but the timing was bad. (Lesson I learned here: some trades can come while you are asleep. When you wake up find them and decide your next entries based on that matter, which means we had to think to short all day till candles close inside the hot zone I marked already long time ago)
Overall how we know it was a choppy day? Therefore I marked all the red and green candles with an X in the image. Can you see how quick the frequency is? A green candle appears then later a red appears then again a green and a red etc. and inbetween we see no other color. (Lesson I learned: watch the frequency of candle green and red. If they start to appear like red green red or green red green we can stay out of trading or we can swing trade the upper and lower edges of the flag or wedge we are in.
Conclusion: Days where we don't trade or miss a trade will occur from time to time. No worries, the market will show millions of new opportunities. Keep on going.
Best Regards
Be a seer, not a looker!
Ata's Trend Hunter V3.5 All Time Return:
35.6%
