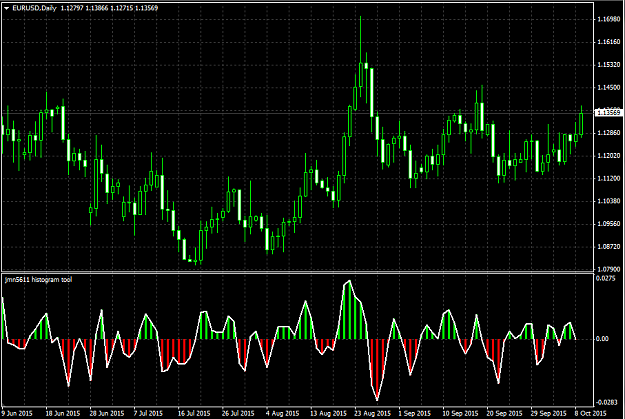
I need a simple tool developed. It needs to be a histogram. I am asking because I want to add it to my thread to help traders navigate a non trending market.
The histogram needs to plot the difference between the close of the current bar, and the close of a bar two periods back. It can update tick by tick if that makes it easier. Ideally it should update at the close of the bar. It needs to have an alert. The alert will fire once when the histogram has a differential that is greater or lesser than the previous two values.
This is easily done in a spreadsheet but following multiple pairs could become laborious.
Any help would be appreciated.
If you are good at something, never do it for free--Joker