Buenos dias,
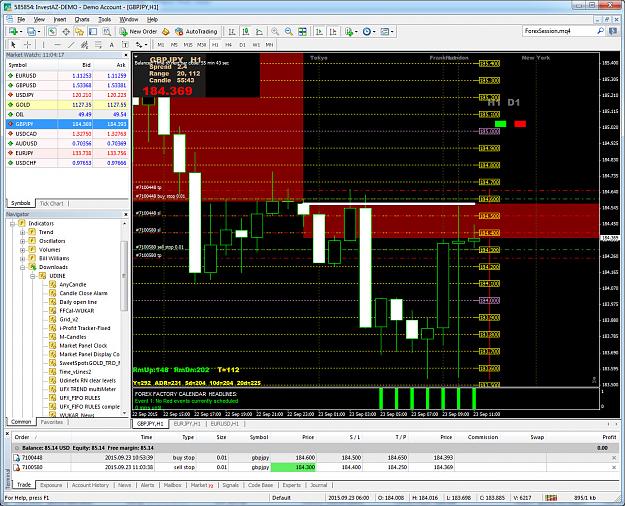
Trade #1 o/t day: GBPJPY to TP
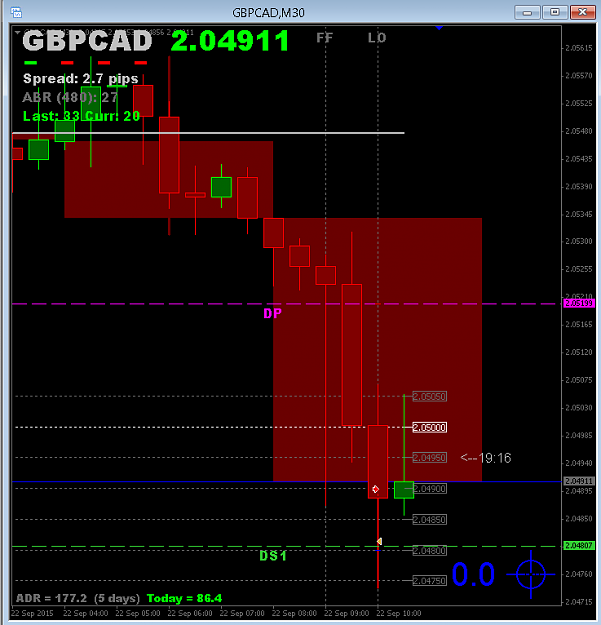
Trade #2 o/t day: GBPCAD to TP
Good thing prices on both went "the right way". Wukar repeatedly tried to close, but got a rather worrying message back from the broker...
LuXing
Trade #1 o/t day: GBPJPY to TP
Trade #2 o/t day: GBPCAD to TP
Good thing prices on both went "the right way". Wukar repeatedly tried to close, but got a rather worrying message back from the broker...
LuXing
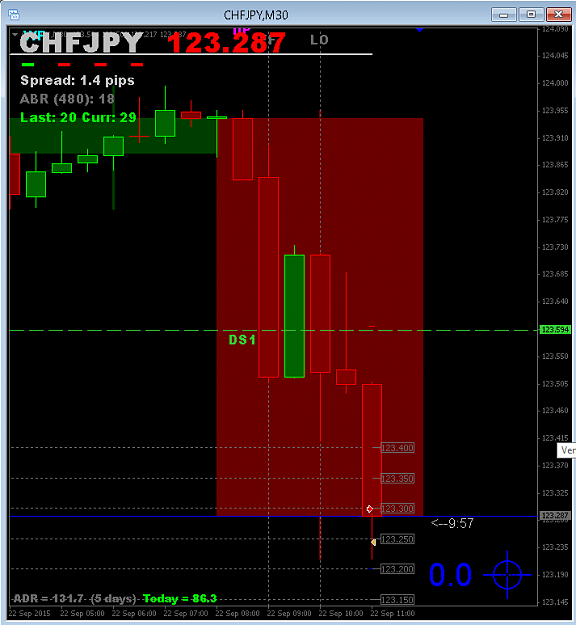
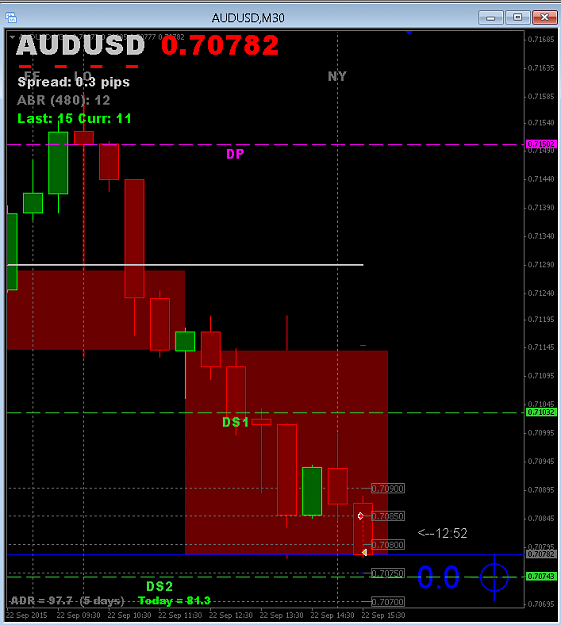
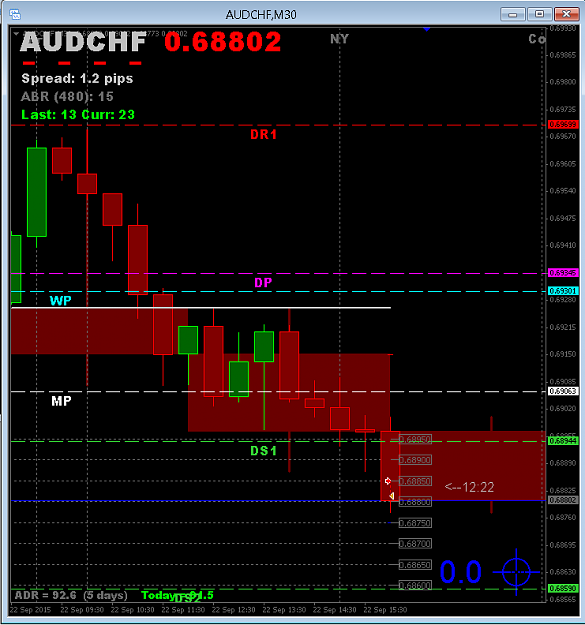
Attached Image(s) (click to enlarge)

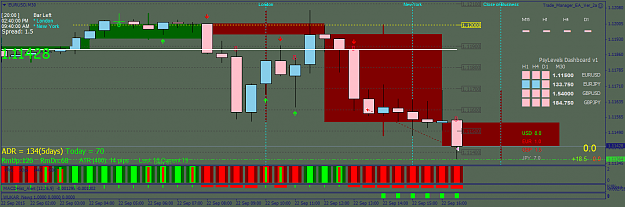
Attached Image

Wisdom begins in wonder