Joined Aug 2013
|
Status: Going with the flow
|244 Posts
Hey guys! Sorry for disappearing. I've been too focused on my trading and unfortunately have become very pressed for time. Maybe if I find a good office space to rent I can keep up with this thread. Until then, life is just to busy to be here consistently posting.
Normally I'm an intraday trader, but I wanted to write about a trade from a more medium-term perspective as an order flow trader and the things I'd be looking out for.
First and foremost, usually when you read about discretionary traders they will tell you that it is really hard to explain what they do or see. After reading this you will probably realize why it's so hard for most of these types of traders to describe their thought process. As a kid, I've had a love for writing from poems and short stories to lyrics and papers and I am usually fairly good at being descriptive, but even the things I write may not make sense without me writing a book or going into in depth details. I will do my best to attempt being thorough without getting too detailed, but you should realize that since you don't have my knowledge and experience as I have come to understand markets, you can't exactly do what I do. This process comes automatically for me and the most time consuming aspect to this is writing out these long posts. Other traders have their own way of trading and understanding of markets, and probably do great; no one way is better than the other.
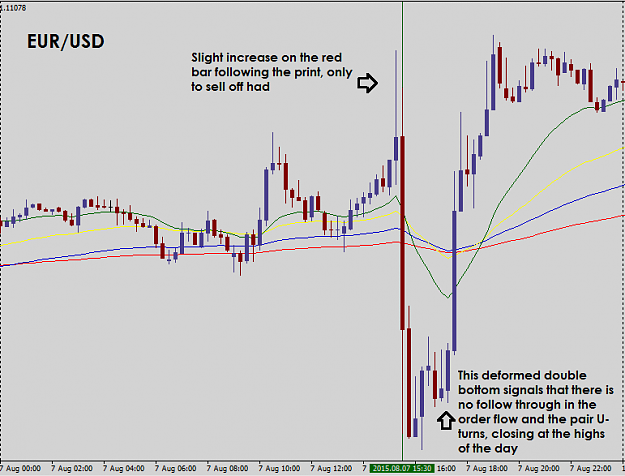
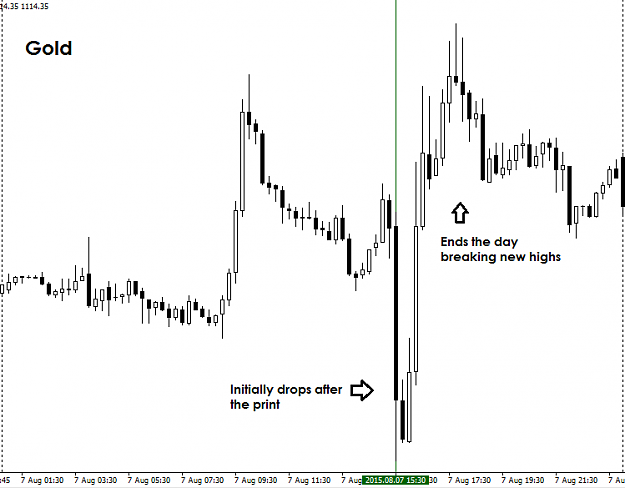
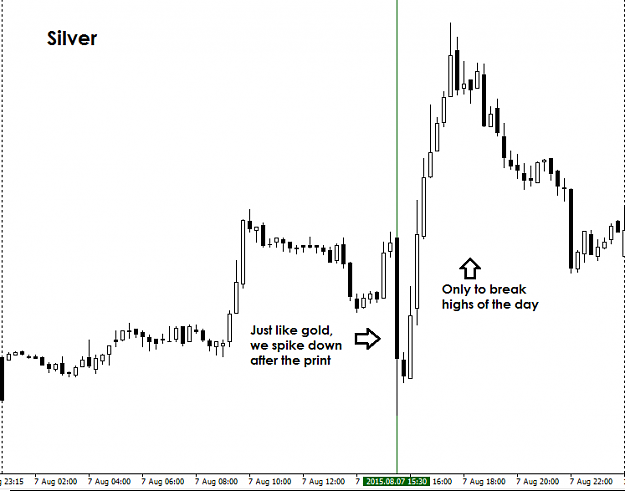
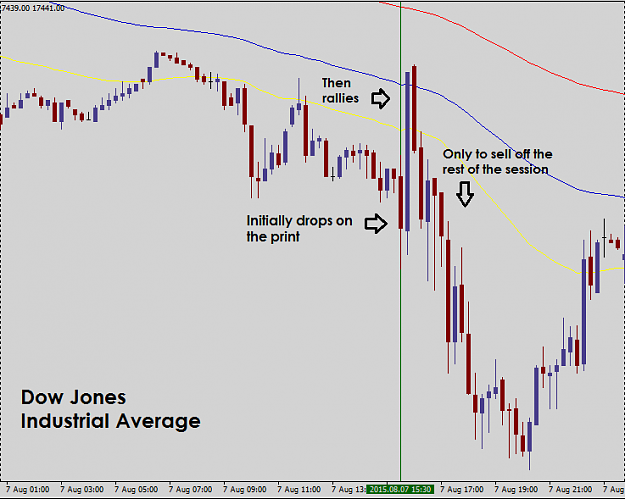
In any case, I wanted to first get into what occured in the EUR/USD over the past week and how it could of been traded on a 4Hr time frame. On 08/07/2015, we had a NFP report come out from the U.S. at 215K vs. 222K exp. This was an important piece of data and basically setup how you would trade this pair over the past week. After the data hit the wires, there was a lot of indecision about what this number meant. On one hand, it was a weaker than expected number and that is bearish for the dollar. On the other, it was still in the Fed's threshold for a rate hike this September. The initial impact led to a slight increase in EUR/USD before selling off. The Dow Jones Industrial Average (DJIA) also initially sold off before rallying. Lastly, gold just dropped on the data. As an order flow trader, I know that liquidity is thin following an important piece of data such as the NFP and although you could, I don't care to trade the initial spike. What's more important to me is how the market reacted to it. EUR/USD erased all losses and closed the day at daily highs. Gold also reached new highs for the day and closed near those highs. DJIA reached lows. To sum things up: EUR/USD↗, Commodities↗, and Equities↘
Attached Image (click to enlarge)
Attached Image (click to enlarge)
Attached Image (click to enlarge)
Attached Image (click to enlarge)
From the reactions, we can infer that market participants took the number to mean the U.S. economy didn't perform as well as they thought it would. A weaker than expected U.S. economy is bearish for USD and bullish for commodities for obvious reasons, and also bad for stocks since they are driven by economic growth. This sort of intermarket action is perfectly in line with a lower than expected number. Just from the price action following the report I can tell that the macro traders (the big guys who play a key role in moving price over the longer-term time frames) didn't think the number was strong enough for them place orders betting the Fed would start rate liftoff beginning in September. This was a signal that EUR/USD probably wouldn't have much downside movements starting the new week, but the fundamentals are only one part of the equation.
Joined Aug 2013
|
Status: Going with the flow
|244 Posts
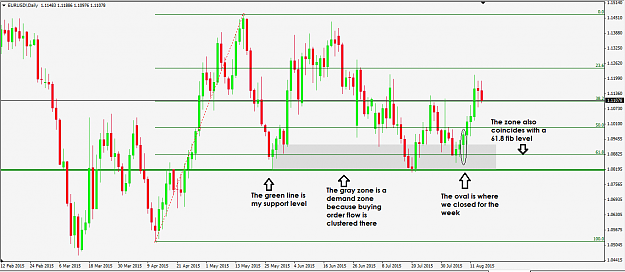
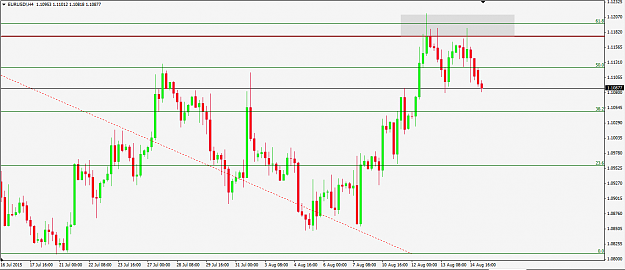
Taking a look at the EUR/USD Daily chart, we could see that price had bounced off of a key area. This was a key area because there was confluence of a support level and 61.8 fibonacci level. This tells us that buying order flow is clustered there and with the way markets reacted post-NFP, the probabilities favored the level holding. The gray rectangle just indicates a demand zone, and we could also see a nice pin bar bouncing off of the demand zone. I saw a lot of traders in the EUR/USD thread calling for the level to hold due to the technical area we were at and the lack of bearish sentiment, and they were right. Whether they made money on it or not is a different matter.
Attached Image (click to enlarge)
Although the probabilities were already fairly decent in going long, I wanted to take it a step further. I knew that I could expect a reaction in the first day, maybe two, before price would signal its intent. Order flow traders play the game tactfully. Rather than chasing price both up and down hoping we can turn profit, we wait for it to reveal what it is likely to do just by considering as many order flow generators as we can and how the price action is acting.
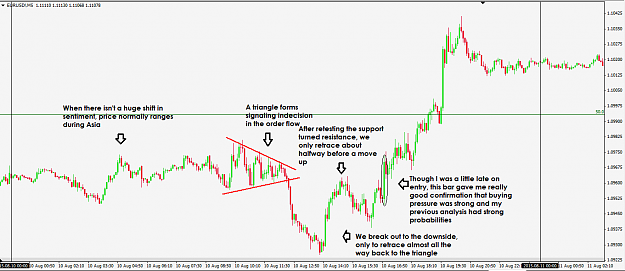
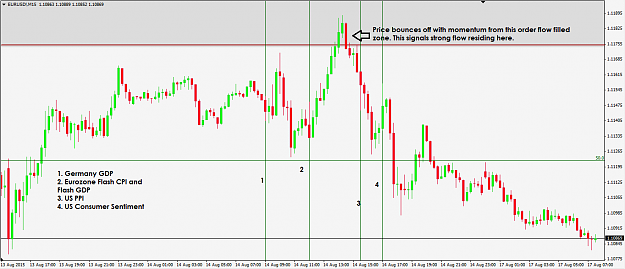
Starting the day we just ranged. This was to be expected as most speculators trade during Europe and NY and commercial order flow plays a bigger role in price movement along with smaller technicals during Asia. During London, a triangle formed and broke out to the downside. This signaled the order book weighted heavier towards the downside, whether that was based on the news that the NFP number was still decent enough to cause the Fed to hike rates in September or just hunting some stops or whatever. That much I couldn't tell you and I was asleep anyways. What did make me extremely confident of a long was how the markets reacted during NY. Right before the NY session opened, price retraced back to the triangle. An almost full retrace of the move down signaled that the flow wasn't extremely strong to the downside, though this could still go either way. Key for me was how after price acted after testing the triangle area as resistance. It retraced halfway down, only to turn with strong momentum forming a deformed double bottom pattern. That big green bar was all I needed to confirm my original analysis because it signaled strong buying pressure.
Joined Aug 2013
|
Status: Going with the flow
|244 Posts
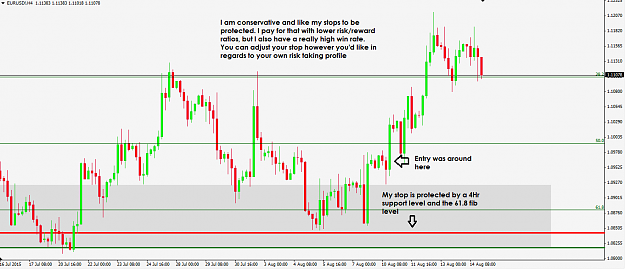
Exits can also be very discretionary. There is no wrong or right way to set your exits. Since I was trading a bounce off of a daily demand zone, I would use the 4Hr time frame to track price movements. As far as stop losses are concerned, I personally like to set them behind technically protected barriers. I am very conservative and on a trade like this I would set my hard stop loss underneath the daily 61.8 fib level and 4Hr support level. This is plenty of confluence and my stop should be easily protected from stop hunters. It's also set at a good area and if that area were to be breached, I would know my original analysis didn't work out and the move against me was a valid one; however, I don't have to wait for my stop loss to be hit in order to get out. Anytime sentiment switches and price action signals bearish momentum, whether it's due to news or some other order flow generator, I'm out. There's no reason to wait for your stop loss to be hit if you know price will most likely go against you. In a situation like that, cutting losses is key and can really help skew your risk/reward ratio in an extremely positive way.
Attached Image (click to enlarge)
I also move my stop up as price goes my way, making sure it is still protected by key technicals.
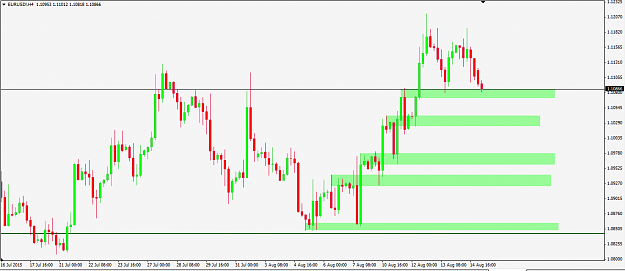
As far as take profit goes, since I am trading a bounce from a daily support area it makes perfect sense to aim for around the daily resistance area. I like to aim for large stop loss clusters because the big players like to purposely hunt these areas in order to get in or out of positions. When you're trading size, liquidity becomes an issue and purposely hitting stop losses can help solve these issues. The red zones indicate stop loss clusters and/or lack of selling pressure. Green line indicates hard take profit, black indicates entry, red indicates hard stop loss. The risk/reward is currently just above 1:1, but remember that I'm extremely conservative and don't use tight stops. I rely more on exiting manually if my analysis tells me to. You could have easily used tighter stops on this setup if you wanted to.
Attached Image (click to enlarge)
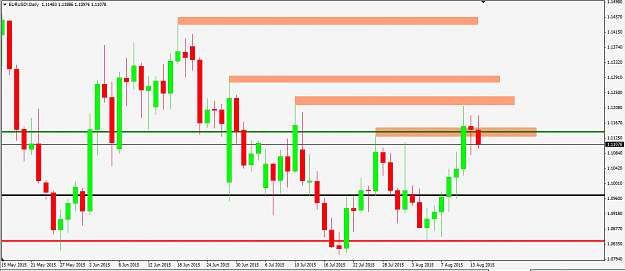
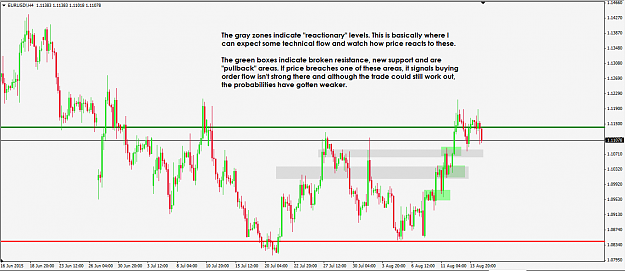
Just like my stops, nothing is written in stone and price can turn at any moment depending on what the order flow looks like. This isn't something you get access to and is why you must use the tools available to you in order to guess what the order flow looks like with high accuracy. Something I can do is mark off reactionary levels. In this example, this is basically just 4Hr technical levels that I can expect a reaction from, whether it is a temporary bounce then break or causes price to U-turn altogether. This is shown by the gray zones. Watching price approach the area on an intraday time frame can help pinpoint what longer-term key levels the market is focusing on, helping make your zones more accurate.
Attached Image (click to enlarge)
The zones serve two purposes for me. 1) I can take partial profits at the zone. You never know how far price will go and when the order flow can turn since you can't see the future. At least taking partial profits will allow you to bank some gains in case price turns against you. 2) These zones outline where you can expect some resistance. By watching price react to this zone and the green one, you can get an idea of which direction it is likely to go next.
The green boxes are pullback areas. These are just broken resistance, newly formed support and an area where I expect new buying pressure to be once tested. If price breaches the area, it signals that buying order flow isn't strong there. If the buying order flow isn't strong there and sellers are stronger, than the probabilities of the trade working out weaken.
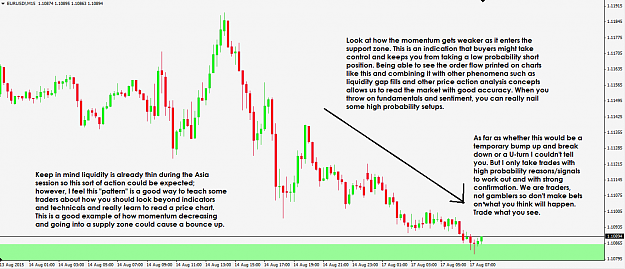
Also keep in mind the momentum of each push. Price, like water, will flow to the area of least resistance. If there is strong momentum behind a move, it signals strong one-directional order flow. As price trended higher and higher, there was strong momentum behind each push up. If the momentum got weak, you would watch price for any signals that bears are about to take control of the market.
Joined Aug 2013
|
Status: Going with the flow
|244 Posts
Now I'm not going to get into the nitty gritty of how I managed the position and kept up with the order flow every day over the week. I will say that each day is different and anything can happen. This is usually why I trade intraday and don't hold any positions overnight unless I see a good setup like the one discussed above. In the beginning of the week, you should know what sentiment is currently like, what key data the market is focused on, what key levels are in play, etc. Each day you need to put yourself in your opponents shoes and think about what they are likely to do given all the informational available. You need to keep up with general sentiment, watch the news feed, look at the reaction to any economic data scheduled that day and think about how it affected markets perceptions, keep an idea of where important technical levels reside, and watch price action to guage the underlying order flow.
This was just one example of a trading style known as intraday swing trading, and management of the position with high probability. Playing the game tactfully is key for me in finding high probability setups. Practicing this over and over has allowed me to really sharpen my metagaming skills and I find myself not doing much better in FX, but also other games as well (where metagaming is key). Many order flow traders will tell you that it has become much harder these days to trade this way due to the low interest rate market enviroment and unpredictability of price. Though I can agree with that, changing the way you look at markets and developing new strategies to exploit market movements can still make order flow trading extremely lucrative. This is just one way to do it. My intraday strategy works even better than this one, and in some aspects is very different.
Of course, you could make order flow trading much simpler. For example, you could trade long-term time frame key technical levels along the side favoring the macro outlook and do really, really well. All of this analysis is just something I have learned to do as an intraday trader and comes natural, and the way my results are there's no reason to make it simpler. My eye is trained well enough to just look at a chart and see where the key levels are, where the reactionary zones are, etc. Order flow trading is just a mentality and understanding of markets. It allows you to build an edge around a exploiting a number of different market inefficiencies. There are a myriad of ways you can take a piece out of the market, some more profitable than the other, some more higher probabilities, than the other, some with better risk/reward ratios than the other, some with more consistent results, you get the point.
Nowadays, I don't have much time to spend on the forums even when I am trading. There's always something going on and I post very infrequently, so I try to make them count. Writing this out is very time consuming so although I won't be here every day, I hope you get the point of how you can use just one way of order flow trading to track market movements and make high probability trades, and if you have any questions feel free to ask. Next, I'd like to outline a potential setup with this style of trading. We'll see how that goes..
For now I'm going to take a break, grab a drink, and enjoy time with my lady. Hope you are all enjoying your weekends!
Joined Aug 2013
|
Status: Going with the flow
|244 Posts
Hello everyone.
This week will be a very interesting one. One of the main things on the markets mind is the potential of a September rate hike. There is a lot of indecision right now about whether that will happen or not and the Fed members themselves are giving out conflicting remarks. Because of this, the big money may be sidelined until Wednesdays FOMC meeting when we hopefully get a more clear picture about their sentiment, although I wouldn't bet on it. Anyways, I wanted to give an example going along with what I previously wrote and things I'd be looking out for.
First, let's recap what happened over the past week. There wasn't too much going on and the main focus was retail sales data from the U.S. The data came out at right about what was expected, and the previous months data was revised up. Unemployment claims was just a tiny bit more than expected.
Attached Image
The data led to indecision as there wasn't a clear consensus on what the number meant. Although retail sales data came out decent given how it's been over the past months, was it good enough to warrant a September rate hike given what's going on with China's yuan and its implications to the U.S. Economy?
Let's take a look at how the markets reacted to the number.
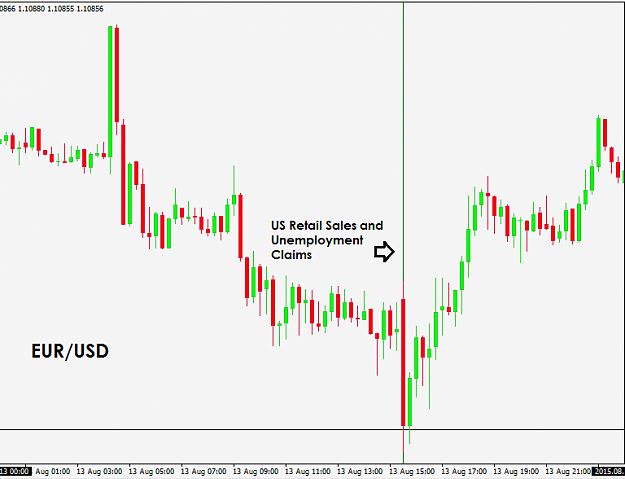
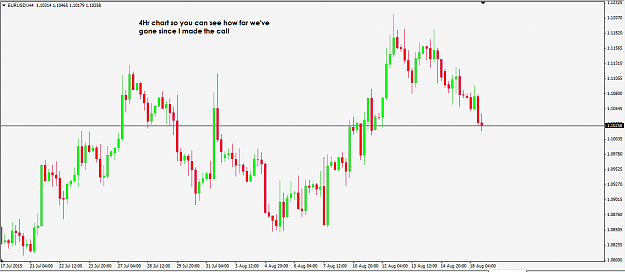
EUR/USD
Attached Image (click to enlarge)
The pair initially spiked down, but closed above session highs. Personally, I thought this was more or less a buy the rumor, sell the news and even the emotion of fear type of play. If you look at price over the day, it was in a downtrend and this tells us the buy-side is net short. When retail sales data came at expectations and wasn't a groundbreaking number, failure of a follow through led to fear and traders were either having their stops hit or taking profits. But it really doesn't matter and as far as I know, my interpretation could be completely wrong. Moving on to other markets..
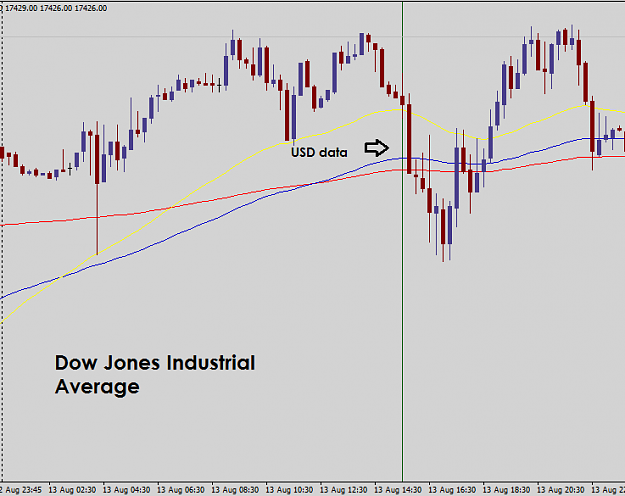
DJIA
Attached Image (click to enlarge)
The Dow Jones had an interesting reaction and honestly, I wasn't even sure how to digest it. It looked like it wanted to go up at first, but without the order flow to move price up it ended up closing lower. This was a good indication that there was a lack of buying pressure and led to price falling hard for the next hour. Suddenly, price breaks upwards with strong momentum and ends up closing the day almost right near where it opened. On the daily chart you see a nice indecision bar (I don't even remember what it's called; as far as I'm concerned, candlestick patterns and names don't matter. What does matter is using them as a tool to read the story, the underlying order flow, combined with your other tools and analysis) and that's how I felt seeing this reaction, indecisive.
Attached Image
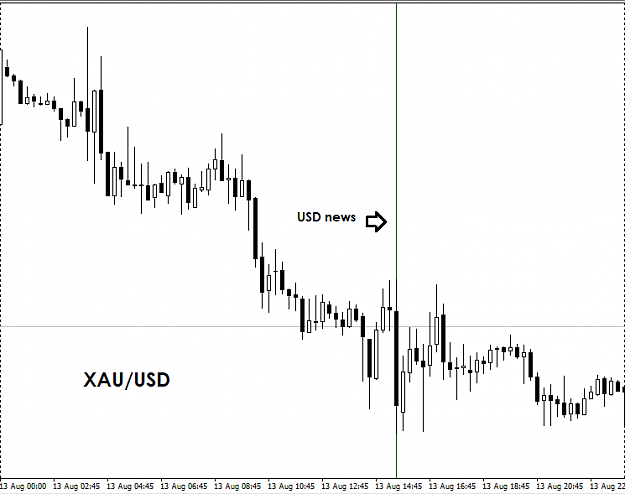
Gold
Attached Image (click to enlarge)
Gold ended up spiking lower on the news, but ended up filling the gap. It did close lower, but the momentum was lacking and it just hung around the support level. This still isn't a clear indication of how market participants perceived this data to be.
So basically the fundamentals and their reactions are leaving me clueless and given the uncertainty around a September rate hike, it makes perfect sense. So the next thing to do is look at the technicals and see what it is telling me.
Joined Aug 2013
|
Status: Going with the flow
|244 Posts
Paul Tudor Jones is a global macro trader who has had amazing success trading and who any trader would strive to be. He believes price comes first and fundamentals second. Why? Think about it. Although fundamentals are extremely important in determining high probability price direction, the price action itself is literally printing the order flow on your charts. Fundamentals can be open to some degree of interpretation, while everyone can see buying and selling pressure via price movement on a chart. Combining both is ideal and leads to amazing probability trade setups, but when the fundamentals are unclear you have to listen to what price is telling you.
Keep in mind that key support and resistance levels usually hold unless news causes them to break. When the fundamentals are unclear and there is no strong sentiment following news, you should approach the markets unbiased. By looking at where we are on the technical road map at key levels and watching how price is reacting to them, you can nail some nice setups.
What are key levels? These are levels that all traders are watching. Support and resistance is one thing that almost all traders look at and you can expect heavy order flow based on this. Confluence is also equally as important. When you have support and resistance traders, Fibonacci traders, moving average traders, etc all lining up their orders in the same area you can expect a reaction to that order flow zone. That being said, let's get to the technicals on EUR/USD.
Attached Image (click to enlarge)
Post-retail sales 1.1175-1.1200 was an area I had noted on my chart. Not only was there a 4Hr resistance level shown by the maroon horizontal line, but also a daily 61.8 fib level and "75" and "00" round psychological level (not marked on the chart). The gray is basically just highlighting the order flow supply zone. I was looking for the level to get tested and hold. With no news to cause a break, it was likely that the level would hold intraday but there were 2 reasons why I wouldn't take the trade on a swing-term basis:
1) With it being Friday, the weekend presented risk. Although not very common, out of nowhere some news could pop up over the weekend and cause a big gap. This uncertainty is what kept me from taking the trade because protecting our capital comes first and foremost before anything else.
2) Friday was filled with data that could lead to changes in order flow. This also presented event risk and combined with the above reason was what kept me out of making a short trade.
So let's recap what happened Friday. In a nutshell, GDP and CPI data out of the Eurozone came out not too great, but the market pretty much didn't care much about this data. PPI data from the U.S. helped cause the dollar to fall from the previously noted resistance area. Consumer sentiment from the U.S. came out negative and after a small spike up, the market disregarded it and price fell down.
Attached Image (click to enlarge)
So I had a technical reason to be bearish and what the reactions to these fundamental events basically confirmed is order flow is strong at the resistance area and it would take much stronger news to cause big market participants to enter orders (and simultaneously take away limit orders) to cause a break of the area. Equally as important is how price tested and bounced with momentum from my supply zone. This signaled strong order flow protecting the area and validated my technical reason to be biased short; whether that is a big move down or a correction in the bigger scheme of things on a move up, I don't know.
Now what I'm looking for is price to show a signal intraday to go short. The 4Hr chart has a double top pattern formed at the resistance area. Anything more than a triple top significantly lowers the probability of the trade going our way (I will explain more about why in a future post). A breakout above 1.1215 will obviously invalidate the setup.
My hard take profit would be set at 1.0845, but price could turn way ahead of this level depending on what is driving the markets. The potential technical reactionary levels I'm watching are highlighted on the chart. The dark green horizontal line represents where I would set my hard take profit, but as stated before I could exit manually anywhere ahead if I feel the control of flow is changing hands.
Attached Image (click to enlarge)
Now we should also be aware of important upcoming events that could affect the order flow. Preparation is always key in playing this game tactfully. Monday and Tuesday are fairly light as far as major sentiment changing data, though some of the data may temporarily affect order flow for a little while. Wednesday, on the other hand, is the most important day of the week due to the FOMC Meeting Minutes data. Participants will be carefully eyeing this to digest how the Fed may feel about recent data and what it could mean for a September rate hike. Ill be flat ahead of this data and make a trade until after seeing how participants reacted to it.
While this may all seem like a lot of work, it is required in order to nail high probability trades. I know it's not as fancy as technical indicator filled charts, but you'll see much better results this way. After some practice, your eye will become trained to see the key levels with ease and your mind will be able to easily filter through news and fundamentals. It ends up becoming much easier and less time consuming with patience, practice, and experience.
As an added update, I wrote this out this morning but wasnt able to get charts done and this posted until tonight. Recent price action from the open has been bearish for EUR/USD, but there would be no signal to short because it happened during Asia. I would prefer a signal during Europe or NY because more speculators are in the market and probabilities are higher. This is just one of those things that you pick up when you learn the market microstructure. Little things like that is why learning order flow analysis is so beneficial, because it helps you filter and be selective with your trades like the pros do.
My analysis suggests support is around 1.1075, and our resistance zone around 1.1175 is still valid. Im personally hoping for support to hold, then a nice short signal in Europe or NY and eventually a break of the support. Only time will tell. Watch how price acts around the support zone and try to figure out if it wants to break up or down. Ill try to be back later! Good luck! Btw if something isnt clear or you find mistakes, let me know. This was typed out as quick as possible and I didnt read over it. Thanks!
Joined Aug 2013
|
Status: Going with the flow
|244 Posts
Unrelated to the above, but I wanted to illustrate how a chart is not just X-price Y-time. There are other "dimensions" in a chart that give clues to what is going on. Things that you don't normally consider like momentum, amount of time price is spending at an area and its implications on an order flow level, liquidity gap fills, or lack of fills signaling strong buying or selling pressure, etc.
Looking at my charts now after annotating this one, some reaction has already happened.
great thread fx. your explanation of order flow analysis would have to be one of the clearest and easiest to understand ive read. cant wait for more damien
Ignored
Hey damien,
Thanks for the kind words!
Hope you are doing well and your results going strong. I'm glad you are enjoying what you're reading and if you have any questions, feel free to ask!
Joined Aug 2013
|
Status: Going with the flow
|244 Posts
Do Support and Resistance Levels Really Get Stronger?
When I talk about order flow analysis, I'm not talking about DOM or Level II. I'm talking about a mindset, an understanding of market structure. I'm talking about metagaming to reverse engineer an order book with good probability based on understanding the reasons why market participants will take trades. I'm talking about using all information available to your advantage to find high probability trade setups. There are a lot of different aspects to learning order flow trading and it isn't easy to learn or teach. But when you really get good at it, you can piece the market to see it for what it really is. For understanding what the technicals really mean and why they were invented in the first place. Why fundamentals play such a key role in market movement. When you learn about market microstructure and order flow interaction with liquidity, it opens up a whole new world as to why price is doing what it is doing. The whole market finally starts making sense.
This was just one of MANY different concepts that came to my mind one day when I was thinking about markets on an order flow level. Although nothing groundbreaking, it helps illustrate how you can slowly piece the market together little by little to understand why things happen like they do. When you begin to see the market from an order flow perspective, your trading will improve tenfold and your win ratio will get much better.
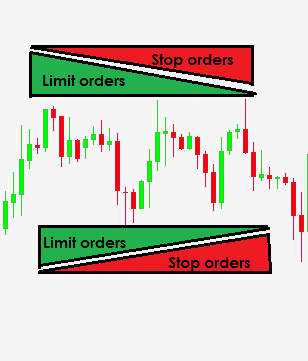
Anyways.. You see, there is this big misconception in the technical world that the more times a support or resistance level gets tested, the stronger it is. This is actually far from the truth and I can basically explain it away with this little image.
Attached Image
Basically, as price tests a support or resistance level the limit orders standing there start getting consumed on each hit while weak stops grow right above or below the levels. Granted, when you see a support or resistance level hold you may place orders based on there, but overall the big players who actually move price will eventually end up running out of steam the more times a level is tested. As the limit orders get exhausted, those nice set of stops sitting there make nice targets to create some volatility. Big players are very likely to hit them for different reasons. Big hedge funds, for example, may use them for liquidity to get in or out of positions. FX dealers may intentionally hit them to make the spread from those orders. Or they may just get hit because orders aren't strong anymore for a support or resistance level to hold for whatever reason. It's all a matter of which side runs out of steam first.
That's my last post for the night. Good luck trading!
Joined Aug 2013
|
Status: Going with the flow
|244 Posts
To add to the above post.
Remember earlier in my posts where I said I will talk more about why the probabilities weaken of a reversal if there's anything more than a triple top?
The more times price hits a support or resistance level, the more limit orders get activated and stops grow. With less orders to protect the level, a breakout becomes likely. The more price hangs around a level, taking pieces away the more the probabilities get higher of the level weakening and breaking.
It's just one more way order flow analysis helps you filter out strong trades from the weak ones.
So summing what's happened in the markets so far, EUR/USD has fallen to a support level. This fall indicated sellers are in control. We bounced from the support level, but have been hanging there hitting away at the limit orders there. The fact that price isn't retracing much and just keeps hitting the support area shows sellers are still strong. There are two possibilities now:
1) Buyers win out. Sellers end up exhausting and can't contain price down. Price starts retracing towards resistance, but if it returns back to support there's a good chance the level may breach due to the number of hits it's had, unless some new piece of information becomes available to the market that changes sentiment and flow. 2) Sellers win out. The Bulls can't hold the support level and we see a break to the next support area.
In any case, I won't be trading at all since it is my birthday today. I'll try to keep up with the price action the rest of the week just to keep showing how discretionary traders view the market.
See you guys later!
Update - interestingly enough, just before I finished this post and was ready to post it, we hit my first reactionary level. So far price is acting like it should. Two possibilities now, price U-turns from here or may or may not bounce before falling further. Watch price and news to find out.
Joined Aug 2013
|
Status: Going with the flow
|244 Posts
Here's another chart to show how a discretionary order flow trader sees things. Not only are we using price to read the underlying order flow, now we are also using reactions to fundamental events to get a good idea of what will happen next with high probabilities favoring our side.
Attached Image (click to enlarge)
Although I did skip this trade idea since I was too busy to babysit it, I hope it helps show the thought process unconsciously going on in head on the trades I take. When each trade you take has a high probability of working out, returns just follow. If I hadn't spent the time to learn market structure and order flow analysis, I'd still be stuck trying to find the next best indicator or technical tool..
From here I would probably take profit. FOMC is coming up tomorrow, volume will probably be light and volatility low. Although a move favoring us could happen during London, it could also use the day to retrace somewhat. Commercial order flow will be playing a bigger role and there is just too much uncertainty for my liking. There's a good chance the next move will happen depending on what comes out of the FOMC meeting, assuming something does. CPI is also an important event and we could see a good sized move on what comes out of it. Have no bias, let the market tell you where it wants to flow next.
Let me also add that the market is currently fairly illiquid. Big financial players are waiting for the macro picture to get clearer before they commit money to the market and that's why we've been stuck in ranging market conditions. Once the big player order flow comes back, the market will become much more predictable and trendy again, and easy money can be made for all types of traders, especially order flow traders; however, even now I am making good returns whereas many of your shorter-term pure technical traders might be having a hard time. When you put the time and effort into learning how the market works, you can build edges around any market condition.
Joined Aug 2013
|
Status: Going with the flow
|244 Posts
Week of 9/6/15
Key Market Themes and Trade Analysis
The previous week's NFP report and other data prints led to more uncertainty and further doubts about rate liftoff starting in September. Although the NFP number was lower than expected, a lower unemployment rate and higher than expected rising wages was good for the dollar. Friday saw some action both ways and closed relatively back in the range, although there was more of a risk-off sentiment bias. There is definitely potential for this type of sentiment to continue when Chinese traders return to the markets after a long holiday.
Monday also marks Labor Day holiday for US traders and we may see slightly lower volume; however, the key market theme to start off the new week will probably be focused on China's equity markets again. A lower open could see risk-off sentiment back in play, and vice versa for risk-on (keep in mind there is data from China out this weekend and that could influence how we open). With US data light until towards the end of the week, I don't expect the Fed interest rate conundrum to play a big role as the key market theme until then.
There will be two ways for me to play the market, either risk-on or risk-off.
Risk-off sentiment:
If the market is in risk-adverse mode, equities should fall, commodities may strengthen, bonds should rally, and JPY should gain due to its use as a funding currency (although Japan's economical relationship with China and slowdown in economic recovery could hit this pair).
If the yen continues to outperform I'll be looking for entries in the following pairs -Short AUD/JPY -Short NZD/JPY -Short GBP/JPY -Short CAD/JPY (keep in mind CAD's relationship to oil and how news about the commodity can affect CAD order flow)
Although less likely, if the yen does begin to struggle due to the recent economic data suggesting a slowdown and China fears and what that may mean for Japan after short covering is exhausted, here's what I may be looking to do -Short AUD/USD -Short NZD/USD -Short AUD/CHF -Short NZD/CHF -Long USD/CAD (once again, keep in mind intermarket relationships) -Short GBP/USD (watch this cautiously)
Risk-on Sentiment:
If, however, the market is in risk-taking mode, equities should rally, commodities may be weaker, bonds should drop, and USD should gain due to its strong global prospects.
These would be my chosen pairs to watch for good entries -Short AUD/USD -Short NZD/USD -Short EUR/USD -Long USD/CAD -Short EUR/GPB (I would tread extremely carefully on this one. There's no reason to catch a falling knife and I would only long this pair after a turn is confirmed technically)
Hopefully we will see more volatility after last week's initial drag since U.S. data is on the light side in the beginning of this new week and this will lead to a more sustainable move/sentiment, but there's no telling how markets will react during such uncertain times.
If you've kept up with the global macroeconomic environment and intermarket relationships you'll know why I selected the pairs above. Any thoughts, feedback, criticism is welcome!
Week of 9/6/15 Key Market Themes and Trade Analysis The previous week's NFP report and other data prints led to more uncertainty and further doubts about rate liftoff starting in September. Although the NFP number was lower than expected, a lower unemployment rate and higher than expected rising wages was good for the dollar. Friday saw some action both ways and closed relatively back in the range, although there was more of a risk-off sentiment bias. There is definitely potential for this type of sentiment to continue when Chinese traders return...
{quote} keep posting.. mr FXMasterSK .. great thread..
Ignored
Thanks buddy. I started assuming not many were reading, but I guess a few are out there. I'll try to continue posting later this week as events unfold and important concepts arise.
This is great!
I've recently transitioned from indicator BS to price action and just when I thought I was enlightened, I came across order flow analysis and realized how much more is there to know and be learnt.
Hope OP will continue teaching about this!
I have the grasp of price action, S/R levels but kinda suck at fundamentals.