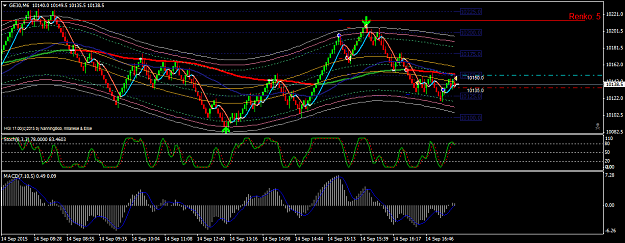
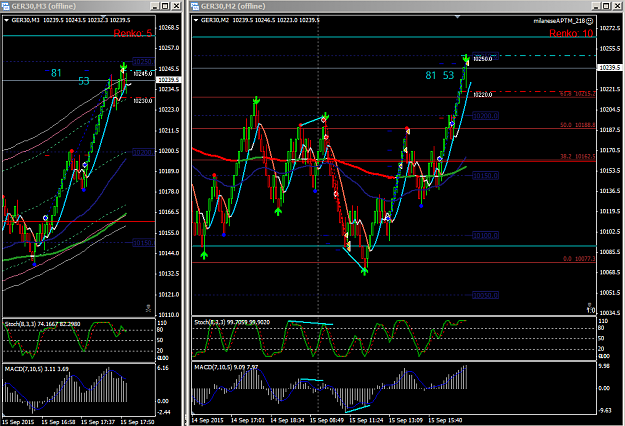
Disliked{quote} Tick charts have constant volume. A new bar begins when the present bar achieved a certain number of ticks: 600, 700, etc. SO volume plays no part here. I define power by: how wide are the ranges of the bars compared to previous bars, I look at the closes (are they near the top, in the middle), I look at how many candles have closes higher than opens, how much progress price makes - how far does it goes after the break (it should extend for a while showing that the break is genuine) {image} Sorry for the "work of art". Sometimes...Ignored
Energy, frequency and vibration.