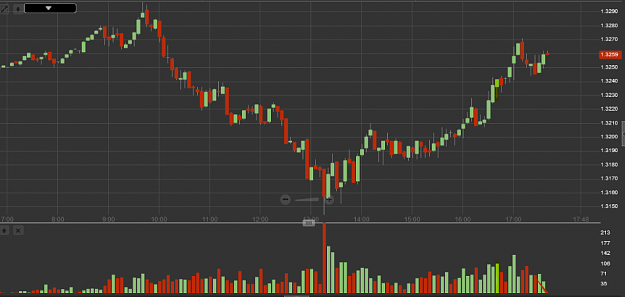
• Home
  • Forums
  • Trades
  • News
  • Calendar
  • Market
  • Brokers
  • Login
  • Join
  • User/Email: Password:
  • 4:40am
Menu
  • Forums
  • Trades
  • News
  • Calendar
  • Market
  • Brokers
  • Login
  • Join
  • 4:40am
Sister Sites
  • Metals Mine
  • Energy EXCH
  • Crypto Craft

Options

Bookmark Thread

First Page First Unread Last Page Last Post

Print Thread

Similar Threads

VSA-divergence trading 187 replies

How to Blow $200 account using VSA--- 594 replies

VSA Journal 57 replies

VSA broker history change datas 11 replies

  • Interactive Trading
  • /
  • Reply to Thread
  • Subscribe
  • 12,340
Attachments: vsa with Malcolm
Exit Attachments
Tags: vsa with Malcolm
Cancel

vsa with Malcolm

  • Last Post
  •  
  • 1 13491350Page 135113521353 1803
  • 1 Page 1351 1803
  •  
  • Post #27,001
  • Quote
  • Aug 20, 2015 10:53am Aug 20, 2015 10:53am
  •  PAStalker
  • | Joined Jun 2015 | Status: Member | 112 Posts
Quoting pres78
Disliked
{quote} Personally I took a 15min chart long at 1.3090. Off 1 hr zone high from yesterday / high of 15 min zone today. Confluence anyone! {image}
Ignored
Hi Pres78, I've searched through the thread for a couple of hours for your VZA. Is there a particular post which outlines the analysis? Unsure what you mean here "Off 1 hr zone high from yesterday / high of 15 min zone today". Are they specific timeframe previous WRB zones?
 
 
  • Post #27,002
  • Quote
  • Aug 20, 2015 11:36am Aug 20, 2015 11:36am
  •  pooh123
  • Joined Jul 2012 | Status: Member | 784 Posts
Quoting PAStalker
Disliked
{quote} Hi Pres78, I've searched through the thread for a couple of hours for your VZA. Is there a particular post which outlines the analysis? Unsure what you mean here "Off 1 hr zone high from yesterday / high of 15 min zone today". Are they specific timeframe previous WRB zones?
Ignored
Please read post#26898.
 
 
  • Post #27,003
  • Quote
  • Aug 20, 2015 12:40pm Aug 20, 2015 12:40pm
  •  pres78
  • Joined Sep 2010 | Status: I'm not here... or am I? | 3,990 Posts
Quoting PAStalker
Disliked
{quote} Hi Pres78, I've searched through the thread for a couple of hours for your VZA. Is there a particular post which outlines the analysis? Unsure what you mean here "Off 1 hr zone high from yesterday / high of 15 min zone today". Are they specific timeframe previous WRB zones?
Ignored
I have written hundreds of posts on the subject showing how I trade these zones.

The chart posted was of a trade taken yesterday (Wednesday) so as noted the entry was into the high (red line) of the highest volume 1 hour bar from Tuesday which was also roughly the same level as the high of the highest volume 15 minute bar from the current trading day (which you can see on the chart).

Also I trade high volume zones, not WRB's specifically. The zones can be WRB, but they can also be normal range bars.
Today's zone = Tomorrow's opportunity!
 
 
  • Post #27,004
  • Quote
  • Aug 20, 2015 1:43pm Aug 20, 2015 1:43pm
  •  PAStalker
  • | Joined Jun 2015 | Status: Member | 112 Posts
Thanks for the replys.
 
 
  • Post #27,005
  • Quote
  • Aug 20, 2015 5:01pm Aug 20, 2015 5:01pm
  •  ZeeDeveel
  • | Joined Jan 2015 | Status: Member | 124 Posts
Quoting pres78
Disliked
Get to the chopper!!!
Ignored
Hey Pres, could you take a look at this screenshot of one of your setups please. I've annotated it with my query. Thanks mate!

Attached Image (click to enlarge)
Click to Enlarge

Name: necY8mN.png
Size: 68 KB
"Never Take a Trade You Don't Understand!" - Pres78
 
 
  • Post #27,006
  • Quote
  • Aug 20, 2015 6:50pm Aug 20, 2015 6:50pm
  •  pres78
  • Joined Sep 2010 | Status: I'm not here... or am I? | 3,990 Posts
Quoting ZeeDeveel
Disliked
{quote} Hey Pres, could you take a look at this screenshot of one of your setups please. I've annotated it with my query. Thanks mate! {image}
Ignored
Honestly the point of that post and chart was not to shown set-ups. It was simply to show each day we get reactions at the previous day UHV zone. I would however consider the last entry you marked as it was a pres78 2BR. NDish bar followed by a lower volume down bar that made a HH, closed on the low and well below 50% of the previous up-bars range.

Like I said though the post and chart was not showing entries specifically.
Today's zone = Tomorrow's opportunity!
 
 
  • Post #27,007
  • Quote
  • Edited 4:39am Aug 21, 2015 4:19am | Edited 4:39am
  •  ZeeDeveel
  • | Joined Jan 2015 | Status: Member | 124 Posts
Quoting pres78
Disliked
{quote} Honestly the point of that post and chart was not to shown set-ups. It was simply to show each day we get reactions at the previous day UHV zone. I would however consider the last entry you marked as it was a pres78 2BR. NDish bar followed by a lower volume down bar that made a HH, closed on the low and well below 50% of the previous up-bars range. Like I said though the post and chart was not showing entries specifically.
Ignored
Thank you, I'd very much appreciate if you could share the main entry signals you'd take in these zones. I find myself always looking for high volume and missing out on a lot of big moves. Obviously we can't catch all the big moves, but I feel as if something's not right with the way I'm doing it. Perhaps I shouldn't expect high volume in these areas if they're in line with the longer term trend? I just think that in areas like that second entry area, wouldn't the herd be jumping on the trend at this point, creating high volume as smart money sells? If I don't see high volume, I get concerned that SM is not interested and the area won't hold. Got a feeling I'm focusing too much on volume and too little on spreads/price action.

In the meantime I'm gonna scour your old posts and see what I can figure out.
"Never Take a Trade You Don't Understand!" - Pres78
 
 
  • Post #27,008
  • Quote
  • Aug 21, 2015 11:34am Aug 21, 2015 11:34am
  •  HiddenGap
  • Joined Aug 2009 | Status: Reading the tape | 2,324 Posts
Quoting pres78
Disliked
{quote} Honestly the point of that post and chart was not to shown set-ups. It was simply to show each day we get reactions at the previous day UHV zone. I would however consider the last entry you marked as it was a pres78 2BR. NDish bar followed by a lower volume down bar that made a HH, closed on the low and well below 50% of the previous up-bars range. Like I said though the post and chart was not showing entries specifically.
Ignored
Sneaky.

Ladies and gentlemen, please read and re-read what is in bold. On the surface Pres78 appears to be saying very little, but in reality he is saying sooooo much.
Wyckoff VSA: (1) Supply vs Demand (2) Effort vs Result (3) Cause vs Effect
 
 
  • Post #27,009
  • Quote
  • Aug 21, 2015 12:23pm Aug 21, 2015 12:23pm
  •  pres78
  • Joined Sep 2010 | Status: I'm not here... or am I? | 3,990 Posts
EURUSD expect to see some resistance at 1.14 to 1.145 zone. Some key stuff in there on the HTF (D & W) charts. At this time I expect this resistance to be temporary and that the bulls will maintain control. Next major point of interest for me if the bulls can clear and hold 1.145 is 1.1675.
Today's zone = Tomorrow's opportunity!
 
 
  • Post #27,010
  • Quote
  • Aug 21, 2015 12:50pm Aug 21, 2015 12:50pm
  •  ZeeDeveel
  • | Joined Jan 2015 | Status: Member | 124 Posts
Quoting HiddenGap
Disliked
{quote} Sneaky. Ladies and gentlemen, please read and re-read what is in bold. On the surface Pres78 appears to be saying very little, but in reality he is saying sooooo much.
Ignored
I'm trying hard to find the significance of this.

The first bar is a ND, which shows the market pausing, uninterested in moving up into the supply zone. The second bar moves into the zone and comes back out of it on even lower volume. So we're at a key level of previous supply, but there is very little interest in the upmove into the supply zone, the upmove is then overcome on very little volume. So the supply zone is largely unchallenged and lower prices should be expected?

I also remember reading something on your blog/journal HG about 50% or the midpoint of the range of candles... Should I revisit this?
"Never Take a Trade You Don't Understand!" - Pres78
 
 
  • Post #27,011
  • Quote
  • Edited 4:51pm Aug 21, 2015 4:02pm | Edited 4:51pm
  •  hieronymus
  • Joined Apr 2015 | Status: Member | 542 Posts
Quoting ZeeDeveel
Disliked
{quote} I'm trying hard to find the significance of this. The first bar is a ND, which shows the market pausing, uninterested in moving up into the supply zone. The second bar moves into the zone and comes back out of it on even lower volume. So we're at a key level of previous supply, but there is very little interest in the upmove into the supply zone, the upmove is then overcome on very little volume. So the supply zone is largely unchallenged and lower prices should be expected? I also remember reading something on your blog/journal HG about...
Ignored
One word covers it all. Test. Most important VSA invterval (and the only one I really trade). That's a test for demand.


Because it's FX, you can just spin it around and see the test. Easier for me to comprehend tests for supply so I do this a lot.
Attached Image (click to enlarge)
Click to Enlarge

Name: Image1.png
Size: 42 KB
 
 
  • Post #27,012
  • Quote
  • Aug 21, 2015 4:07pm Aug 21, 2015 4:07pm
  •  FxAndres
  • | Commercial Member | Joined Jun 2012 | 310 Posts
http://prntscr.com/87cvf4
Trading 24/h
 
 
  • Post #27,013
  • Quote
  • Aug 21, 2015 9:16pm Aug 21, 2015 9:16pm
  •  HiddenGap
  • Joined Aug 2009 | Status: Reading the tape | 2,324 Posts
Quoting ZeeDeveel
Disliked
{quote} I'm trying hard to find the significance of this. The first bar is a ND, which shows the market pausing, uninterested in moving up into the supply zone. The second bar moves into the zone and comes back out of it on even lower volume. So we're at a key level of previous supply, but there is very little interest in the upmove into the supply zone, the upmove is then overcome on very little volume. So the supply zone is largely unchallenged and lower prices should be expected? I also remember reading something on your blog/journal HG about...
Ignored
Names are not that important, but I would call it an Up Thrust in the form of No Demand.

What I was actually referring to is this:

Pres78 has spent a lot of time extolling the virtues of Volume at Volume. Yet he remains cognizant of the power of (Lack of ) Volume at Volume. Tom Williams always speaks about looking for low volume signals in areas where there was previously high volume.

Then Pres78 goes a bit further. He speaks about the bar making a higher high. I would add, and not make a lower low. This is what the uninformed might call a "Buying Bar". The herd would see this as a sign of strength. After all, you don't make higher highs in a down trend; you make lower highs. This type of bar is powerful and useful to the Smart Money because they are so counter-intuitive. Pres78 goes on to note that the close in near the low of the range. Would a bar of strength close near it's low? Then to take things to a new level, Pres78 mentions that the bar fails to close above the 50% range of the previous up bar.

In sum, You've got (Lack of) Volume at Volume, Effort vs Result, Pure Price Action and Market Psychology all wrapped up into a two bar signal known as a PRES78 2BR. Something for everyone's tool kit.
Wyckoff VSA: (1) Supply vs Demand (2) Effort vs Result (3) Cause vs Effect
 
 
  • Post #27,014
  • Quote
  • Aug 24, 2015 11:42am Aug 24, 2015 11:42am
  •  Sonofsin5
  • Joined Jan 2009 | Status: Fading the specs | 1,374 Posts
Days like today are very important to traders with size as it gives them an opportunity to either dump or accumulate large positions without market impact or notice.
I am seeing signs in crude that point to large traders trying to put in a floor. We may be close to a bottom here.
Either way, I would be sitting on my hands today.
Gl out there.
 
 
  • Post #27,015
  • Quote
  • Aug 24, 2015 12:11pm Aug 24, 2015 12:11pm
  •  pres78
  • Joined Sep 2010 | Status: I'm not here... or am I? | 3,990 Posts
Quoting Sonofsin5
Disliked
Days like today are very important to traders with size as it gives them an opportunity to either dump or accumulate large positions without market impact or notice. I am seeing signs in crude that point to large traders trying to put in a floor. We may be close to a bottom here. Either way, I would be sitting on my hands today. Gl out there.
Ignored
Yes crazy day for sure. Huge ranges. No news (well no "posted" news anyway). It's days like this that throw all the analysis out the window. But it's great as well as we are seeing some huge volume which for me = some great zones for trading in the coming days.

For me I am still basically flat across the board as far as long term trades and positions go on CAD, AUD, NZD and Oil. Just intra-day trading at the moment on these guys for now waiting for some clearer signs that it's time for me to lock into some holding positions.

Gotta love the volatility in these Summer months.
Today's zone = Tomorrow's opportunity!
 
 
  • Post #27,016
  • Quote
  • Aug 25, 2015 10:51am Aug 25, 2015 10:51am
  •  RaverStyleTim2
  • | Joined Mar 2007 | Status: Member | 418 Posts
Trying to stay with these formations during uptrend. Was not the strongest entry, but the trend was up, we had a bar that goes down and back up on higher volume above previous bar close(however, not high).
Attached Image (click to enlarge)
Click to Enlarge

Name: entry.PNG
Size: 44 KB
 
 
  • Post #27,017
  • Quote
  • Aug 25, 2015 11:49am Aug 25, 2015 11:49am
  •  Vcv13
  • Joined Feb 2013 | Status: Member | 262 Posts
Hey guys did you enjoy the roller coaster ride on EURUSD?

long till y'day, short today

Attached Image
The loss was not bad luck. It was bad Analysis - D.Einhorn
 
 
  • Post #27,018
  • Quote
  • Aug 25, 2015 11:56am Aug 25, 2015 11:56am
  •  Vcv13
  • Joined Feb 2013 | Status: Member | 262 Posts
pure text book stuff, full of test in rising markets, effort to rise, WCIOU bar, there was also a squat, effort to fall, no demands

making Guru Tom Williams proud today.
The loss was not bad luck. It was bad Analysis - D.Einhorn
 
 
  • Post #27,019
  • Quote
  • Aug 25, 2015 12:08pm Aug 25, 2015 12:08pm
  •  pres78
  • Joined Sep 2010 | Status: I'm not here... or am I? | 3,990 Posts
Quoting Vcv13
Disliked
Hey guys did you enjoy the roller coaster ride on EURUSD? long till y'day, short today {image}
Ignored
Intraday shorts today. Sure why wouldn't we? Highest 1 hour volume zone from yesterday formed right at the days high and come LO today we were testing into the low. Checked off my intraday trading plan boxes for reasons to take a few shorts today.

Another big range day. We are back down testing into the resistance levels that were blown apart yesterday. See if they hold as support now.

Me thinks the EURSUD run up is not over just yet. I am still holding some longer term Daily longs trailing them up as we go looking for reasons to add on, hold on or get out.
Today's zone = Tomorrow's opportunity!
 
 
  • Post #27,020
  • Quote
  • Aug 25, 2015 12:24pm Aug 25, 2015 12:24pm
  •  Vcv13
  • Joined Feb 2013 | Status: Member | 262 Posts
Hey Pres, what your goin to call this..this 1h day's high zone once you decide to write a book?
The loss was not bad luck. It was bad Analysis - D.Einhorn
 
 
  • Interactive Trading
  • /
  • vsa with Malcolm
  • Reply to Thread
    • 1 13491350Page 135113521353 1803
    • 1 Page 1351 1803
1 trader viewing now
  • More
Top of Page
  • Facebook
  • Twitter
About FF
  • Mission
  • Products
  • User Guide
  • Media Kit
  • Blog
  • Contact
FF Products
  • Forums
  • Trades
  • Calendar
  • News
  • Market
  • Brokers
  • Trade Explorer
FF Website
  • Homepage
  • Search
  • Members
  • Report a Bug
Follow FF
  • Facebook
  • Twitter

FF Sister Sites:

  • Metals Mine
  • Energy EXCH
  • Crypto Craft

Forex Factory® is a brand of Fair Economy, Inc.

Terms of Service / ©2023