I realized some traders after learning some basics from babypips, still do not know how to trade the basic because the internet doesn't show you the reality of the market movement, as internet always show you the perfect scenario where this is not the case. I will just show some simple examples of how you can make use of the available data to form a basic trading plan, without using any profound mathematical terms or statistical knowledge. I will start with support and resistance.
Support/Resistance
To make things easier and save some time, I will take some examples from trading the support.
1. Draw some lines at bottoms (Decide yourself if you want support at candle close or low, be decisive as you will follow it in your trading plan, if not use a line chart)
2. Check how many bounces off the support
3. Check how many breakout thru the support
4. Check what is the lowest number of pips to the top
5. Check what is the highest number of pips to the top
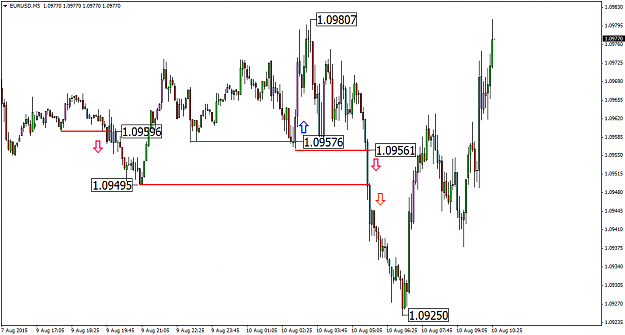
Ok, let's do the maths in this 5 min live chart.
1. Breakout thru support == 3
2. Bounce off the support == 1
3. Pips gain from breakout >>>
a) 1.0959-1.0949 == 10 pips
b) 1.0957-1.0925 == 32 pips
c) 1.0949-1.0925 == 24 pips
4. Pips gain from bounce off >>>
a) 1.0980-1.0957 == 23 pips
So here come your data collection of a simple trading system.
1. Percentage of trading bounce off in this X timeframe == 25%
2. Percentage of trading breakout in this X timeframe == 75%
Let's assume we are going to trade according to the 75% winning rate system, but we need to decide our TP and SL. So lets look at the possible loss and win we can make.
1. Gains from break are 10, 32 and 24 pips. Let's be conservative. We will take 10 pips as take profit, because it shown that 10 pips are sure hit out of the data we collected.
2. Loss from bounce are 23 pips. Let's be conservative again. We will take 10 pips as stop loss.
So according to this examples, we will have the following results.
3 trades of hitting 10 pips TP == 30 pips profit
1 trade that move 23 pips == 10 pips loss
Result == Net 20 pips profit
Winning Rate == 75%
If you have a higher risk tolerance, you can set 25 pips SL, and you have a better result as it reverse after moving 23 pips and give you a breakeven or a profit.
The above is just an example. The more data you collect, the more specific and detail your collections and research, you will have more confidence in your trading plan. There's also spread to consider, news events, etc to consider and enhance your trading system.
If you are only a part time trader or you only have time for some time frame, then collect the data from xx:00 to yy:00 time, so you know what you can expect from your trading availability.
Good luck.
Support/Resistance
To make things easier and save some time, I will take some examples from trading the support.
1. Draw some lines at bottoms (Decide yourself if you want support at candle close or low, be decisive as you will follow it in your trading plan, if not use a line chart)
2. Check how many bounces off the support
3. Check how many breakout thru the support
4. Check what is the lowest number of pips to the top
5. Check what is the highest number of pips to the top
Ok, let's do the maths in this 5 min live chart.
1. Breakout thru support == 3
2. Bounce off the support == 1
3. Pips gain from breakout >>>
a) 1.0959-1.0949 == 10 pips
b) 1.0957-1.0925 == 32 pips
c) 1.0949-1.0925 == 24 pips
4. Pips gain from bounce off >>>
a) 1.0980-1.0957 == 23 pips
So here come your data collection of a simple trading system.
1. Percentage of trading bounce off in this X timeframe == 25%
2. Percentage of trading breakout in this X timeframe == 75%
Let's assume we are going to trade according to the 75% winning rate system, but we need to decide our TP and SL. So lets look at the possible loss and win we can make.
1. Gains from break are 10, 32 and 24 pips. Let's be conservative. We will take 10 pips as take profit, because it shown that 10 pips are sure hit out of the data we collected.
2. Loss from bounce are 23 pips. Let's be conservative again. We will take 10 pips as stop loss.
So according to this examples, we will have the following results.
3 trades of hitting 10 pips TP == 30 pips profit
1 trade that move 23 pips == 10 pips loss
Result == Net 20 pips profit
Winning Rate == 75%
If you have a higher risk tolerance, you can set 25 pips SL, and you have a better result as it reverse after moving 23 pips and give you a breakeven or a profit.
The above is just an example. The more data you collect, the more specific and detail your collections and research, you will have more confidence in your trading plan. There's also spread to consider, news events, etc to consider and enhance your trading system.
If you are only a part time trader or you only have time for some time frame, then collect the data from xx:00 to yy:00 time, so you know what you can expect from your trading availability.
Good luck.
Attached Image (click to enlarge)
The only winner is the one who survive the longest...