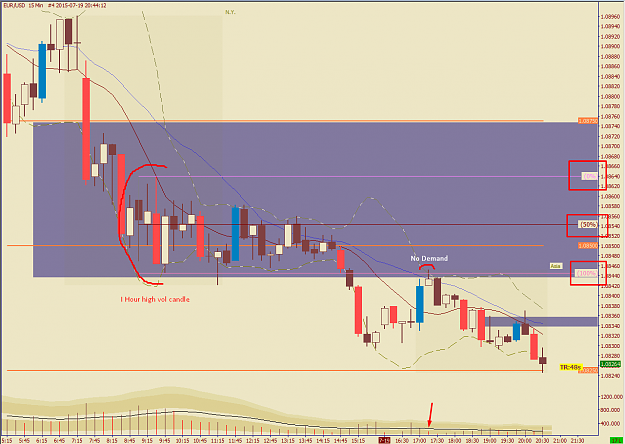
{quote} Entries can be taken inside the zone however the preferred entries are into the low from below and into the high fom above. I consider the 50% as a hinge point where I would be more looking for shorts when price is below and longs above but that is NOT a fixed rule. Take today on EURUSD... The high was the location for the short today. There is still the need for being able to read and understand PA and what the bar prints and volume are showing us. As for the test in the zone but not at a level......
Ignored
just what I wanted to read
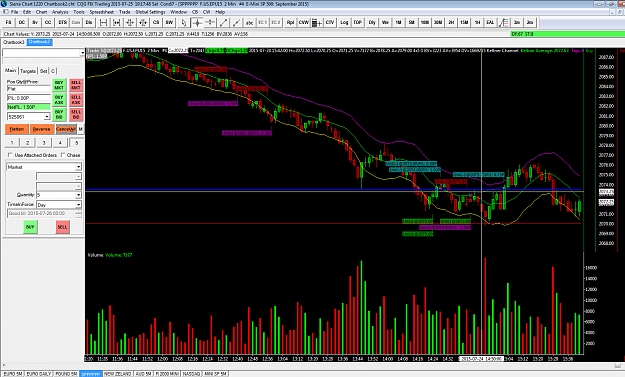
about high volume entries what exactly did you mean? high volume tests or squats? any chart to explain with? thanks
The loss was not bad luck. It was bad Analysis - D.Einhorn
{quote} can you show me you short entry point? Thanks
Ignored
What about you try and guess? Look at yesterday's chart and when it was trading up against the 1.0960 level. Post a chart with your analysis of a 15m or 5m chart. And where you think good entries would've been.
{quote} What about you try and guess? Look at yesterday's chart and when it was trading up against the 1.0960 level. Post a chart with your analysis of a 15m or 5m chart. And where you think good entries would've been.
Ignored
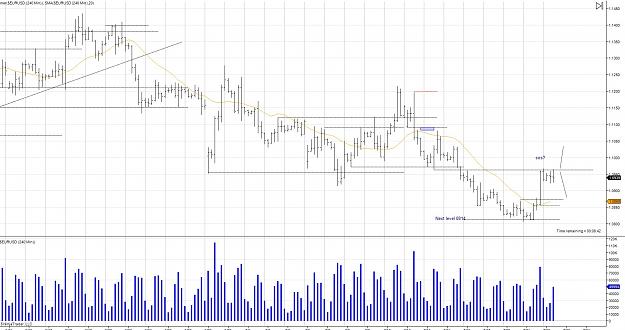
sure here it is, after 3 efforts failed to fructify into results, even if I shorted it would have been in the circled area only, but I couldn't find an entry there & also there was lot of support below so I was wondering where did you find an entry point?
Attached Image (click to enlarge)
The loss was not bad luck. It was bad Analysis - D.Einhorn
|
Joined Aug 2009
|
Status: Small solid bricks
|358 Posts
Keep in mind I use a 10m so my charts look a bit different. I shorted before the UT printed.
My analysis was Daily trend down, 4h trend down. And 1h and 10m hit resistance.
I saw confirmation from the UT with a recent new low and good volume, I saw the retrace
was week and entered.
Follow the LL's and LH's
The long you ad was a good trade
Also look for strong breaks of support or resistance
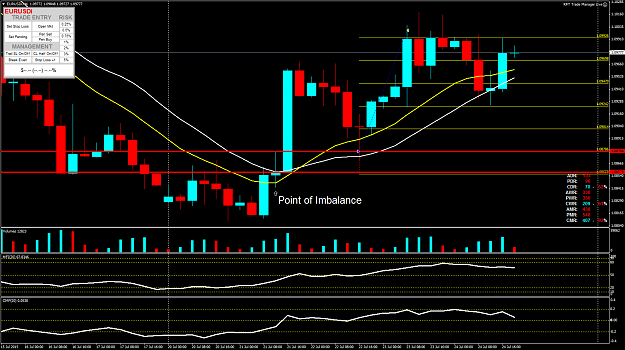
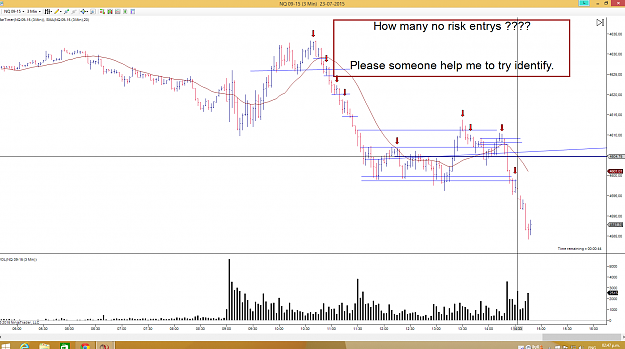
Intrested to see how this EU 4H chart plays out, I am short already on a 10m. A target of 1.0880 would be ideal. Anyone else looking at any potential trades or ideas {image}
Ignored
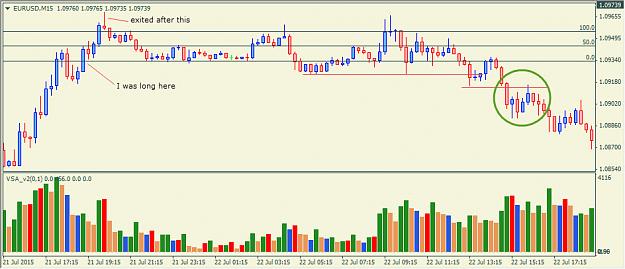
Did not take a short but I was watching that same little zone you had on your chart from 1.088ish to 1.086ish... Huge imbalance seen at this area where all supply was overtaken and a massive buyers push up was seen. When price returned back to this point of imbalance we were in buy mode with PA above our MA's and money flow showing buyers in control.
I entered and exited as shown for a bit better than 5:1 risk - reward.
Joined Sep 2010
|
Status: I'm not here... or am I?
|4,000 Posts
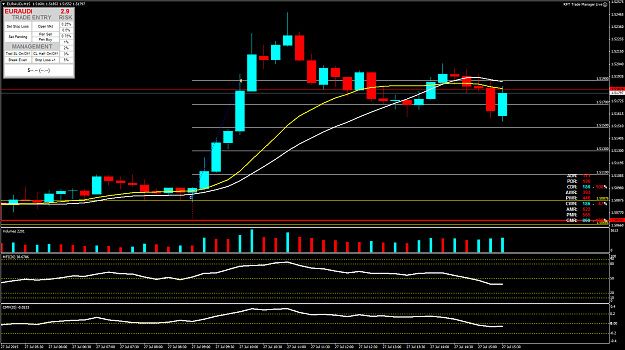
Took a FO long on EURAUD.
1.50876 is the high of the Friday 1 hour zone (yellow fib).
1.50707 (red line) is the July 10th Daily high which had been broken on Friday (with a beautiful buyers take over within a previous daily supply zone - look at the 4hr chart... it was a thing of beauty)
Market opens small gap up showing buyers strength. We tested along the red line early on and when FO came we has been testing the fib zone high.
Set a pending right at FO for a few pips above the zone high at 1.509, SL ay 1.507 with a fixed 5:1 TP before the next round number level at 1.5190. I am not crazy about entering a long from below a round number like 1.51 but with all the SOS and buyers support seen Friday and so far today I felt confident in higher prices.
Money Flow was still showing buyers in control and my entry was in fact a nice 2BR into the zone high and had I not already been in I would have entered at the close of that upbar.
Took a FO long on EURAUD. 1.50876 is the high of the Friday 1 hour zone (yellow fib). 1.50707 (red line) is the July 10th Daily high which had been broken on Friday (with a beautiful buyers take over within a previous daily supply zone - look at the 4hr chart... it was a thing of beauty) Market opens small gap up showing buyers strength. We tested along the red line early on and when FO came we has been testing the fib zone high. Set a pending right at FO for a few pips above the zone high at 1.509, SL ay 1.507 with a fixed 5:1 TP before the next...
Nice trade pres78, How do you use the MFI and CMF, those confirm the trade?, and what MA do you have in your chart?. Thanks {quote}
Ignored
I use the MFI as sign of who is in control as it is based on volume and price (still testing it). Basically above 50 buyers , below 50 sellers. Keep an eye on 80-90 and 10-20 as signs of being OB or OS. One of the biggest things I am testing it for is divergence as an early sign trends are ending. If price is going up and the MFI is going down it can be (not always) a sign that trends are slowing and I will use for getting out of dying trends etc... Disclaimer - still testing.
The CMF is used in a similar manner for divergences and gauging who is in control except the median point is the 0 line. Disclaimer - again still testing.
They are 20 MA, one simple and one linear weighted.
Joined Sep 2010
|
Status: I'm not here... or am I?
|4,000 Posts
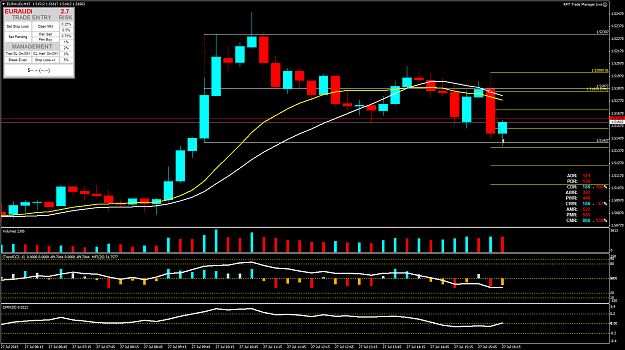
Grabbed a quick short scalp playing the levels from today's 1 hr zone. We had seen sellers at the high and a rejection at the mid so I took advantage of the 40 pips between 50% and low.
Entry 1.5185, TP 1.5145, SL 1.52 for not quite 3:1.
As expected now we are seeing some support at the zone low.
{quote} I use the MFI as sign of who is in control as it is based on volume and price (still testing it). Basically above 50 buyers , below 50 sellers. Keep an eye on 80-90 and 10-20 as signs of being OB or OS. One of the biggest things I am testing it for is divergence as an early sign trends are ending. If price is going up and the MFI is going down it can be (not always) a sign that trends are slowing and I will use for getting out of dying trends etc... Disclaimer - still testing. The CMF is used in a similar manner for divergences and gauging...
Joined Sep 2010
|
Status: I'm not here... or am I?
|4,000 Posts
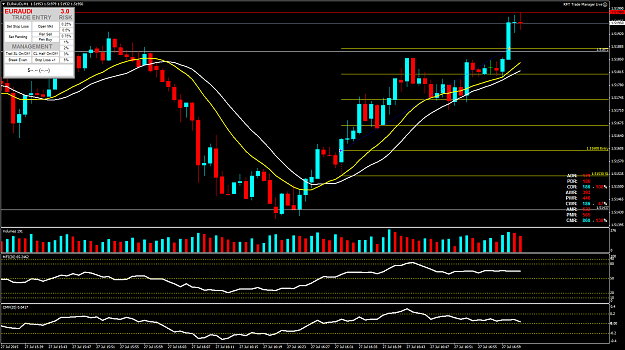
EURAUD...
Watch 5220-5230ish area...
Key overhead level to watch 5331 (starting at 5300).
We have entered a major previous supply zone today (price fell 1650 pips from here starting Dec 2014 ending at the April 2015 low). We took out a minor supply zone on Friday (as noted in a previous post the bulls pulled off a thing of beauty on Friday... check out a NY close 4 hour chart).
I expect this zone may put up more of a fight and have noted the key 5330 level to watch for reactions.
I am currently looking to long from somewhere in the 5220-5330 area (could be as low as 5190) up to that Dec 2014 high and will re-evaluate from there.