• Home
  • Forums
  • Trades
  • News
  • Calendar
  • Market
  • Brokers
  • Login
  • Join
  • User/Email: Password:
  • 7:39pm
Menu
  • Forums
  • Trades
  • News
  • Calendar
  • Market
  • Brokers
  • Login
  • Join
  • 7:39pm
Sister Sites
  • Metals Mine
  • Energy EXCH
  • Crypto Craft

Options

Bookmark Thread

First Page First Unread Last Page Last Post

Print Thread

Similar Threads

VSA-divergence trading 187 replies

How to Blow $200 account using VSA--- 594 replies

VSA Journal 57 replies

VSA broker history change datas 11 replies

  • Interactive Trading
  • /
  • Reply to Thread
  • Subscribe
  • 12,338
Attachments: vsa with Malcolm
Exit Attachments
Tags: vsa with Malcolm
Cancel

vsa with Malcolm

  • Last Post
  •  
  • 1 13431344Page 134513461347 1803
  • 1 Page 1345 1803
  •  
  • Post #26,881
  • Quote
  • Edited 2:08pm Jul 13, 2015 1:43pm | Edited 2:08pm
  •  pres78
  • Joined Sep 2010 | Status: I'm not here... or am I? | 3,990 Posts
To simplify;

Sell when the SM are selling and thus the market is weak... buy when the SM are buying and the market is strong. Be on the side with the power to create the market moving imbalances.

Today's zone = Tomorrow's opportunity!
 
 
  • Post #26,882
  • Quote
  • Jul 13, 2015 3:36pm Jul 13, 2015 3:36pm
  •  HiddenGap
  • Joined Aug 2009 | Status: Reading the tape | 2,324 Posts
Quoting pres78
Disliked
To simplify; Sell when the SM are selling and thus the market is weak... buy when the SM are buying and the market is strong. Be on the side with the power to create the market moving imbalances.
Ignored
Sounds like wanting what the market wants.
Wyckoff VSA: (1) Supply vs Demand (2) Effort vs Result (3) Cause vs Effect
 
 
  • Post #26,883
  • Quote
  • Jul 13, 2015 7:14pm Jul 13, 2015 7:14pm
  •  pete148
  • | Joined Aug 2009 | Status: Small solid bricks | 358 Posts
Guys I am keen to find out what timeframes most of you use that find some success, and how long you look to keep trades. And how many trades per day on average. Your average stop size?
I have found that less is more and aiming for 2 trades a day works well for me.

I ask this because I feel alot of people get stuck trading 5m charts and strugling, then getting into bad habits. Basically over trading with 7 pip stops

Thanks
 
 
  • Post #26,884
  • Quote
  • Jul 13, 2015 9:16pm Jul 13, 2015 9:16pm
  •  HiddenGap
  • Joined Aug 2009 | Status: Reading the tape | 2,324 Posts
Quoting Vcv13
Disliked
HiddenGap (or if anyone else who is reading & would like to answer) you have defined a selling candle in one of your old posts as one that makes a lower low and not a higher high, so is the prima facie indication of the selling candle is, it is a SoW? My confusion is I remember you said in a reply to my query once that a bar since it had made a lower low & than closes on it mid point indicated there was some buying that came in. Thank you.
Ignored
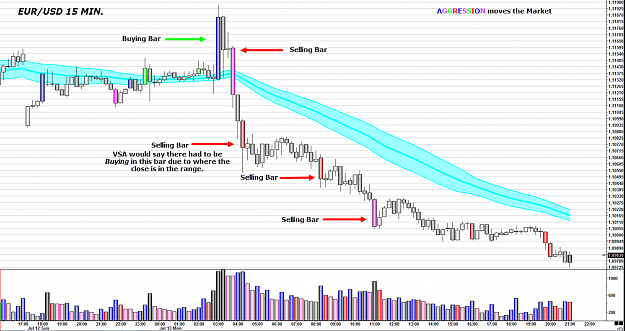
The terms "Buying Bar" and "Selling Bar" are terms used by many trader to describe a certain type of bar. These terms have nothing to do with VSA. However, the SM knows these terms and uses them to their advantage.

Buying Bar: A Buying Bar is a bar that makes a Higher High than the previous bar and makes a High Low than the previous bar.

Selling Bar: A Selling Bar is a bar that makes a Lower Low than the previous bar and makes a Lower High than the previous bar.

The first thing these two definitions should remind you of is the most basic definition of an uptrend and a downtrend. An Uptrend is defined as Higher Highs and Higher Lows. While a downtrend is defined as Lower Lows and Lower Highs. So in effect, buying and selling bars are two interval trends bars.........

Take a look at the picture below.

I will not get into Aggression Bars here, but note the Buying and Selling Bars marked.

Take a look at the second Selling bar. It is called a Selling Bar because it is making a Lower Low and a Lower High than the previous bar. But VSA would note that the close on the volume indicate that there must have been some Buying in this bar. Especially since the next bar closes up.
Attached Image (click to enlarge)
Click to Enlarge

Name: Aggression 6.png
Size: 185 KB
Wyckoff VSA: (1) Supply vs Demand (2) Effort vs Result (3) Cause vs Effect
 
 
  • Post #26,885
  • Quote
  • Jul 13, 2015 9:50pm Jul 13, 2015 9:50pm
  •  pooh123
  • Joined Jul 2012 | Status: Member | 784 Posts
Quoting pete148
Disliked
Guys I am keen to find out what timeframes most of you use that find some success, and how long you look to keep trades. And how many trades per day on average. Your average stop size? I have found that less is more and aiming for 2 trades a day works well for me. I ask this because I feel alot of people get stuck trading 5m charts and struggling, then getting into bad habits. Basically over trading with 7 pip stops Thanks
Ignored
I trade m5 and have on average 2 trades a day. It seems that you can get a lot of trades on m5 on 8 major pairs. However, if you stick to Gavin's rule of having trend alignment on at least three timeframes, you don't get a lot of trades. My problem is, often time I don't stick to this rule and jump the gun. I noticed that, back in 2011 you posted many good trades without trend alignment, which would be considered by Gavin as aggressive and risky. However those trades turned out to be successful. Do you still trade that way, like place long trade with price under PBL ? Actually I was caught in between following your approach and Gavin's rule.

As for how long I keep trades, I use fixed TP of around 1:1 or higher, depending on S/R level in the direction of my trade. My stop size is 30 pips on average.
 
 
  • Post #26,886
  • Quote
  • Jul 13, 2015 11:05pm Jul 13, 2015 11:05pm
  •  hieronymus
  • Joined Apr 2015 | Status: Member | 542 Posts
Quoting pooh123
Disliked
{quote} I trade m5 and have on average 2 trades a day. It seems that you can get a lot of trades on m5 on 8 major pairs. However, if you stick to Gavin's rule of having trend alignment on at least three timeframes, you don't get a lot of trades. My problem is, often time I don't stick to this rule and jump the gun. I noticed that, back in 2011 you posted many good trades without trend alignment, which would be considered by Gavin as aggressive and risky. However those trades turned out to be successful. Do you still trade that way, like place long...
Ignored
Gavin takes aggressive trades himself (he repeatedly states how "you can go long/short here if you're aggresive" etc), he just teaches a safe sheepish way to trade for the masses. No offense to him or anyone really, if you're going to try and teach thousands of people a system, you make it pretty much the way TG has. I haven't looked at any trades by Malcomb, the thread starter, but I take it he still traded the old TG way. TG is a good spring board but you just can't teach people how to really trade, they have to learn on their own imo.
 
 
  • Post #26,887
  • Quote
  • Jul 13, 2015 11:12pm Jul 13, 2015 11:12pm
  •  hieronymus
  • Joined Apr 2015 | Status: Member | 542 Posts
Quoting pete148
Disliked
Guys I am keen to find out what timeframes most of you use that find some success, and how long you look to keep trades. And how many trades per day on average. Your average stop size? I have found that less is more and aiming for 2 trades a day works well for me. I ask this because I feel alot of people get stuck trading 5m charts and strugling, then getting into bad habits. Basically over trading with 7 pip stops Thanks
Ignored
Fewer trades and higher TF is probably better for most, I trade 1m,2m,3m,5m,15m,30m,60m,240m,720m but only enter a trade from 1-15m, mostly 1,3, or 5. Usually take one good high probability trade off the 15m. Avg trades a day is prob 7 or 8 and avg stop is 5, sometimes 3 or 4 but 12 at most. I take so many trades out of a desire to explore and expand my system in a live environment, on purpose. It is nice to see what others do but it may not help that much.
 
 
  • Post #26,888
  • Quote
  • Jul 13, 2015 11:51pm Jul 13, 2015 11:51pm
  •  hieronymus
  • Joined Apr 2015 | Status: Member | 542 Posts
Quoting HiddenGap
Disliked
{quote} The terms "Buying Bar" and "Selling Bar" are terms used by many trader to describe a certain type of bar. These terms have nothing to do with VSA. However, the SM knows these terms and uses them to their advantage. Buying Bar: A Buying Bar is a bar that makes a Higher High than the previous bar and makes a High Low than the previous bar. Selling Bar: A Selling Bar is a bar that makes a Lower Low than the previous bar and makes a Lower High than the previous bar. The first thing these two definitions should remind you...
Ignored
This is what the thread has been missing : )
 
 
  • Post #26,889
  • Quote
  • Jul 14, 2015 2:04am Jul 14, 2015 2:04am
  •  Vcv13
  • Joined Feb 2013 | Status: Member | 262 Posts
Quoting SimpleDev
Disliked
{quote} Now look at the widespread down bar, it needs the excessive volume to push down through all of those previous bars. Notice how the next bar closes lower not confirming the buying on the widespread down bar.
Ignored
Quoting HiddenGap
Disliked
{quote} So in effect, buying and selling bars are two interval trends bars.........

Take a look at the second Selling bar. It is called a Selling Bar because it is making a Lower Low and a Lower High than the previous bar. But VSA would note that the close on the volume indicate that there must have been some Buying in this bar. Especially since the next bar closes up. {image}
Ignored
Hey thank you SD & HG, glad to see you guys here & posting. I consider you three (along with pres78) my Gurus.

So in conclusion an up selling bar or a down selling bar are a SoW only can be confirmed by the subsequent PA.

The deeper I dig into VSA I end up with the same conclusion, any bar just coz it fits the description given in the VSA bible is not a SoW or SoS till the market itself confirms it (in my opinion).

I have to stop using terms to define bars, End of Rising Market & Gotcha bars & Spring & selling & buying bar. I think they only add to the confusion. It is wise to leave aside these terms & check if the bar is an up or a down bar, close is well off the low/high or on it, volume low or high & than see how the market reacts to the bar. The SM may be knowing such terms and using them to their advantage but this terminology is not working for me.

Yeah but the only term working for me is "Effort".
The loss was not bad luck. It was bad Analysis - D.Einhorn
 
 
  • Post #26,890
  • Quote
  • Jul 14, 2015 5:31am Jul 14, 2015 5:31am
  •  SimpleDev
  • Joined Apr 2010 | Status: Retired | 575 Posts
Quoting Vcv13
Disliked
The deeper I dig into VSA I end up with the same conclusion, any bar just coz it fits the description given in the VSA bible is not a SoW or SoS till the market itself confirms it
Ignored
Can't stress this enough. My trading jumped forward leaps and bounds by watching for confirmation bars.

If you look at your chart you will see it still isnt perfect but using proper money management being profitable becomes a lot easier.
 
 
  • Post #26,891
  • Quote
  • Jul 14, 2015 5:39am Jul 14, 2015 5:39am
  •  SimpleDev
  • Joined Apr 2010 | Status: Retired | 575 Posts
Quoting pete148
Disliked
Guys I am keen to find out what timeframes most of you use that find some success, and how long you look to keep trades. And how many trades per day on average. Your average stop size? I have found that less is more and aiming for 2 trades a day works well for me. I ask this because I feel alot of people get stuck trading 5m charts and strugling, then getting into bad habits. Basically over trading with 7 pip stops Thanks
Ignored
I like 5m charts, couple of years ago 3m were great then I started having issues with them.

Amount of trades depends on the day, some I can take 3 trades some days I cant find any. SL depends on the market, if the day is volatile I risk less capital with a stop just beyond the stopping volume, if the day is moving nicely then risk more capital with stop just beyond the ND/NS. Ive always liked scalping so I am in a trade anywhere from 1 to 3 bars, depending on how the market is acting.
 
 
  • Post #26,892
  • Quote
  • Jul 14, 2015 7:49am Jul 14, 2015 7:49am
  •  pete148
  • | Joined Aug 2009 | Status: Small solid bricks | 358 Posts
Quoting pooh123
Disliked
{quote} I trade m5 and have on average 2 trades a day. It seems that you can get a lot of trades on m5 on 8 major pairs. However, if you stick to Gavin's rule of having trend alignment on at least three timeframes, you don't get a lot of trades. My problem is, often time I don't stick to this rule and jump the gun. I noticed that, back in 2011 you posted many good trades without trend alignment, which would be considered by Gavin as aggressive and risky. However those trades turned out to be successful. Do you still trade that way, like place long...
Ignored
I had most success following gavin's rule, however on counter trend trades or ones where the trend is defined yet, I have strict set up rules. I am sure Gavin also talks about this in his book. Where a counter trend trade needs more sos or sow's.

Hieronymus - Thank you for contributing, I am with you in Gavin gives you the basic's but it is your job to go and do something with it. Its like a millionaire saying here is what you have to do, you still have to take action, see your results, re access and take action again till you get the result you want.
I believe in a systematic way of trading ( 3 TF's trends aligning) because I think that is the only way to long term consistent success.

Simple DEV - I have also found that looking for about 2 trades a day per pair has been beneficial. For me it helps me quantify my edges and follow the right process if I know I only have around 2 trades a day.
 
 
  • Post #26,893
  • Quote
  • Jul 14, 2015 8:06am Jul 14, 2015 8:06am
  •  SimpleDev
  • Joined Apr 2010 | Status: Retired | 575 Posts
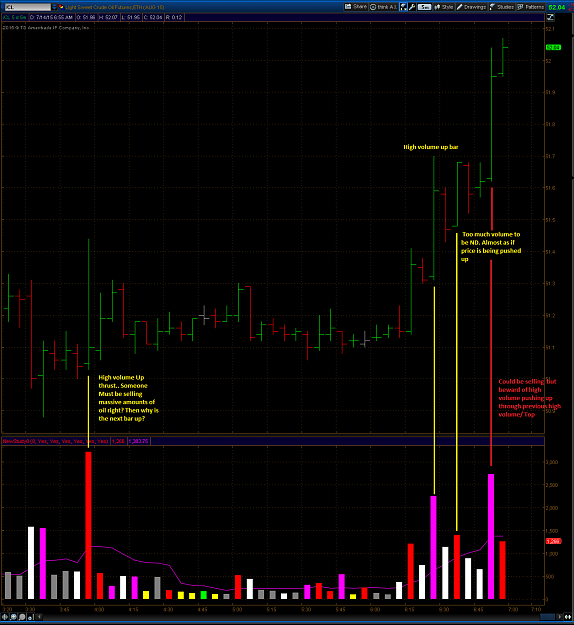
Oil Futures chart..

No trades that I would want to be in on this chart, just showing thought process.
Attached Image (click to enlarge)
Click to Enlarge

Name: Oil.png
Size: 74 KB
 
1
  • Post #26,894
  • Quote
  • Jul 14, 2015 9:29pm Jul 14, 2015 9:29pm
  •  pres78
  • Joined Sep 2010 | Status: I'm not here... or am I? | 3,990 Posts
Trading can be simple.

Volume whether Futures or Forex = activity.

Activity = opportunity.

I have beat this to death but I trade this way everyday. I use VZA to know where I want to look for trades.

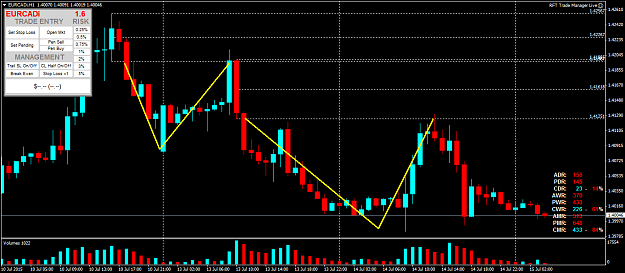
Very simple, shows the power of knowing where trades are most likely to set up. This is two of hundreds of examples. Pull up any 1 hour chart, apply zones to the highest volume bars and see how many reactions we get. Day in day out... volume at volume.

EURCAD - 1 hour chart

July 10th zone at the days high, close below the zone (and at the days low) = sellers zone. July 13th sellers kill it at the low.

July 13th zone at the days high, close below the zone (and at the days low) = sellers zone. Today sellers kill it at the low.

Take entries off the 1hr or drop down and pin point entries.

Easy.
Attached Image (click to enlarge)
Click to Enlarge

Name: EURCADiH1.png
Size: 57 KB
Today's zone = Tomorrow's opportunity!
 
 
  • Post #26,895
  • Quote
  • Jul 14, 2015 11:06pm Jul 14, 2015 11:06pm
  •  pooh123
  • Joined Jul 2012 | Status: Member | 784 Posts
Another classic post of this thread. I'll make a PDF copy of it.
 
 
  • Post #26,896
  • Quote
  • Jul 15, 2015 7:47am Jul 15, 2015 7:47am
  •  pres78
  • Joined Sep 2010 | Status: I'm not here... or am I? | 3,990 Posts
Quoting pres78
Disliked
Trading can be simple. Volume whether Futures or Forex = activity. Activity = opportunity. I have beat this to death but I trade this way everyday. I use VZA to know where I want to look for trades. Very simple, shows the power of knowing where trades are most likely to set up. This is two of hundreds of examples. Pull up any 1 hour chart, apply zones to the highest volume bars and see how many reactions we get. Day in day out... volume at volume. EURCAD - 1 hour chart July 10th zone at the days high, close below the zone (and at the days low) =...
Ignored
Another day another simple EURCAD trade. As I said when you know the most likely places that the best trade set-ups are going to occur you have an advantage.

July 15th short from? Anyone?

The low of yesterday's 1hr highest volume zone you say... well sir we have a winner!

Easy.
Today's zone = Tomorrow's opportunity!
 
 
  • Post #26,897
  • Quote
  • Jul 15, 2015 9:36am Jul 15, 2015 9:36am
  •  pres78
  • Joined Sep 2010 | Status: I'm not here... or am I? | 3,990 Posts
Follow the volume (yes even in Forex... OK fine follow the ticks )...

The volume is our road map. We can follow the SM, no software required. No trade signals needed, just our eyes and our charts. In many cases we can plan our trading day the night before with great accuracy. We know what is worth watching for trades and what is not worth our time. Hell we can even set some alerts in MT4 for our "key levels" and wait for the emails to open our charts back up.

The short term tides are changing on EURCAD (sticking with this one for consistancy). The sell the rallies into the 1 hour zones is looking like it may be buy the dips in the coming days.

Can you see it happening? Follow the volume.
Today's zone = Tomorrow's opportunity!
 
 
  • Post #26,898
  • Quote
  • Jul 15, 2015 10:26am Jul 15, 2015 10:26am
  •  pooh123
  • Joined Jul 2012 | Status: Member | 784 Posts
Quoting pres78
Disliked
Follow the volume (yes even in Forex... OK fine follow the ticks )... The volume is our road map. We can follow the SM, no software required. No trade signals needed, just our eyes and our charts. In many cases we can plan our trading day the night before with great accuracy. We know what is worth watching for trades and what is not worth our time. Hell we can even set some alerts in MT4 for our "key levels" and wait for the emails to open our charts back up. The short term tides are changing on EURCAD (sticking with this one for consistancy)....
Ignored
Thank you a million Pres ! I'm learning something from each and every post of yours !
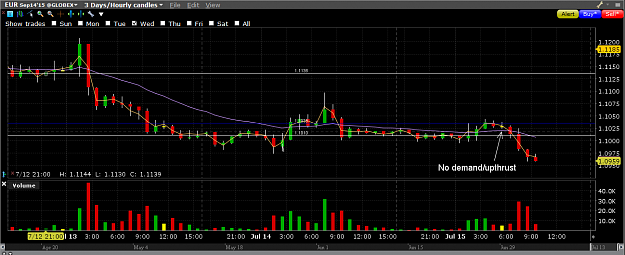
Attached is an one-hour chart of EUR. The blue line shows the low of the bar from yesterday with the highest volume. Your method really works !
Attached Image (click to enlarge)
Click to Enlarge

Name: Screenshot1.png
Size: 100 KB
 
 
  • Post #26,899
  • Quote
  • Jul 15, 2015 10:34am Jul 15, 2015 10:34am
  •  pres78
  • Joined Sep 2010 | Status: I'm not here... or am I? | 3,990 Posts
Quoting pooh123
Disliked
{quote} Thank you a million Pres ! Your method really works ! {image}
Ignored
No problem. I am always happy if I can help make life a little easier for any of my fellow volume traders. Trading does not need to be complicated. We can follow the SM and trade in sync with them.

I have been trading my VZA / VSA method for quite some time now and it works as good today as it ever has. Actually this year has been wonderful for trading with volume in general because the markets have been very active.
Today's zone = Tomorrow's opportunity!
 
 
  • Post #26,900
  • Quote
  • Jul 15, 2015 11:16am Jul 15, 2015 11:16am
  •  Sonofsin5
  • Joined Jan 2009 | Status: Fading the specs | 1,374 Posts
Quoting pres78
Disliked
{quote} No problem. I am always happy if I can help make life a little easier for any of my fellow volume traders. Trading does not need to be complicated. We can follow the SM and trade in sync with them. I have been trading my VZA / VSA method for quite some time now and it works as good today as it ever has. Actually this year has been wonderful for trading with volume in general because the markets have been very active.
Ignored
Great Job finding something that's consistently working for you.
The markets are now almost entirely controlled by machines and HFT black boxes; your system trades around high levels of activity where machine orders are most likely to generate their signals as well.
Volume is activity, you've found a nice niche, keep it up.
 
 
  • Interactive Trading
  • /
  • vsa with Malcolm
  • Reply to Thread
    • 1 13431344Page 134513461347 1803
    • 1 Page 1345 1803
2 traders viewing now
  • More
Top of Page
  • Facebook
  • Twitter
About FF
  • Mission
  • Products
  • User Guide
  • Media Kit
  • Blog
  • Contact
FF Products
  • Forums
  • Trades
  • Calendar
  • News
  • Market
  • Brokers
  • Trade Explorer
FF Website
  • Homepage
  • Search
  • Members
  • Report a Bug
Follow FF
  • Facebook
  • Twitter

FF Sister Sites:

  • Metals Mine
  • Energy EXCH
  • Crypto Craft

Forex Factory® is a brand of Fair Economy, Inc.

Terms of Service / ©2023