Hi!
 B.S. Trading with Kenneth Lee
- #6,165
- May 17, 2015 10:50am May 17, 2015 10:50am
- Joined Aug 2009 | Status: Reading the TAPE | 2,389 Posts
Without VSA, you're playing checkers while the Smart Money plays chess.
- #6,167
- Jun 29, 2015 12:03pm Jun 29, 2015 12:03pm
- Joined Feb 2011 | Status: Probabilities, Not Absolutes | 1,246 Posts
- #6,169
- Jul 31, 2015 5:57am Jul 31, 2015 5:57am
- Joined May 2011 | Status: Trader | 1,265 Posts
'Fail to plan, plan to fail'
- #6,170
- Jul 31, 2015 6:27am Jul 31, 2015 6:27am
- Joined May 2011 | Status: Trader | 1,265 Posts
'Fail to plan, plan to fail'
- #6,171
- Aug 1, 2015 4:42am Aug 1, 2015 4:42am
- Joined May 2011 | Status: Trader | 1,265 Posts
'Fail to plan, plan to fail'
- #6,172
- Aug 2, 2015 9:04pm Aug 2, 2015 9:04pm
- Joined Feb 2011 | Status: Probabilities, Not Absolutes | 1,246 Posts
- #6,173
- Aug 2, 2015 9:05pm Aug 2, 2015 9:05pm
- Joined Feb 2011 | Status: Probabilities, Not Absolutes | 1,246 Posts
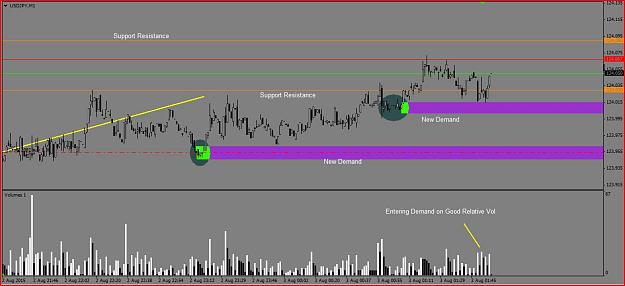
- #6,174
- Aug 2, 2015 9:26pm Aug 2, 2015 9:26pm
- Joined Feb 2011 | Status: Probabilities, Not Absolutes | 1,246 Posts
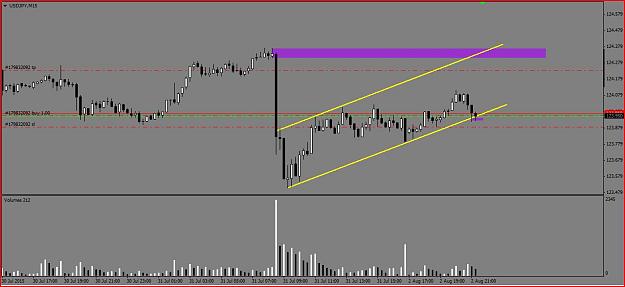
- #6,175
- Aug 2, 2015 9:49pm Aug 2, 2015 9:49pm
- Joined Feb 2011 | Status: Probabilities, Not Absolutes | 1,246 Posts
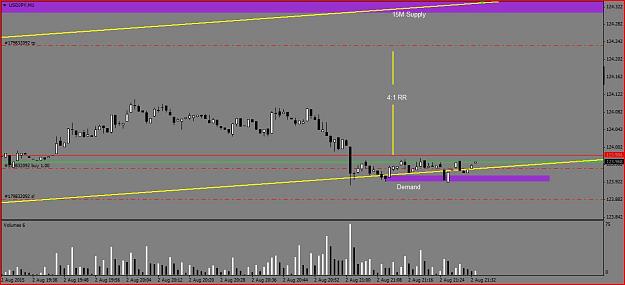
- #6,176
- Aug 2, 2015 9:54pm Aug 2, 2015 9:54pm
- Joined Feb 2011 | Status: Probabilities, Not Absolutes | 1,246 Posts
- #6,177
- Aug 2, 2015 10:02pm Aug 2, 2015 10:02pm
- Joined Feb 2011 | Status: Probabilities, Not Absolutes | 1,246 Posts
- #6,178
- Aug 2, 2015 10:18pm Aug 2, 2015 10:18pm
- Joined Feb 2011 | Status: Probabilities, Not Absolutes | 1,246 Posts
- #6,179
- Aug 2, 2015 10:28pm Aug 2, 2015 10:28pm
- Joined Feb 2011 | Status: Probabilities, Not Absolutes | 1,246 Posts
- #6,180
- Aug 2, 2015 11:03pm Aug 2, 2015 11:03pm
- Joined Feb 2011 | Status: Probabilities, Not Absolutes | 1,246 Posts