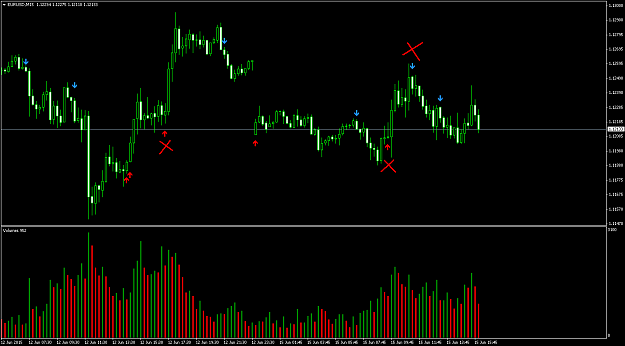
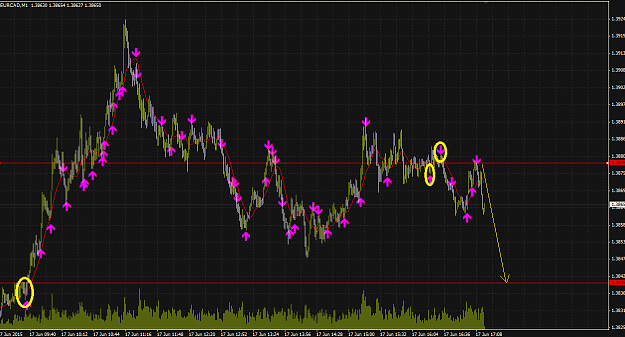
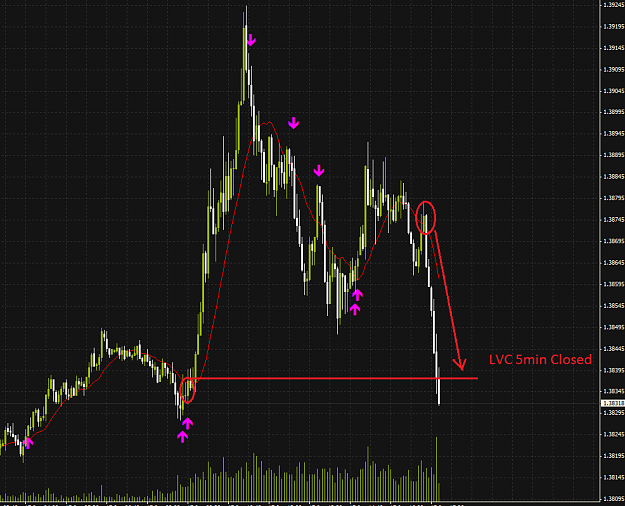
• Home
  • Forums
  • Trades
  • News
  • Calendar
  • Market
  • Brokers
  • Login
  • Join
  • User/Email: Password:
  • 3:26pm
Menu
  • Forums
  • Trades
  • News
  • Calendar
  • Market
  • Brokers
  • Login
  • Join
  • 3:26pm
Sister Sites
  • Metals Mine
  • Energy EXCH
  • Crypto Craft

Options

Bookmark Thread

First Page First Unread Last Page Last Post

Print Thread

Similar Threads

M candles / Custom candles for second charts 0 replies

How to select last four candles with Highest price or Volume? 8 replies

Bull & bear candles volume counter 4 replies

Consecutive candles indi combined with volume & spread indi 13 replies

Calculating only buy candles vs sell candles 2 replies

  • Trading Discussion
  • /
  • Reply to Thread
  • Subscribe
  • 106
Attachments: Low Volume Candles
Exit Attachments
Tags: Low Volume Candles
Cancel

Low Volume Candles

  • Last Post
  •  
  • 1 56Page 789 18
  • 1 6Page 78 18
  •  
  • Post #121
  • Quote
  • Jun 15, 2015 5:27am Jun 15, 2015 5:27am
  •  abokwaik
  • Joined Sep 2012 | Status: No guts, no glory | 3,624 Posts
Quoting Mingary
Disliked
{quote} Thanks, Here is another example that just happened. 06:45 GMT EURUSD 1M {image} {image}
Ignored
I don't see the LVC arrows on you chart, It seems you don't have Wingdings font installed. I've attached one for you, download, unzip and copy to ...Windows/Fonts Folder.

I think you're saying that it would a good time to sell when volume decreases on rallies, and buy when volume decreases on pullbacks. Please correct me if I misunderstood.
Attached File(s)
File Type: rar wingding.rar   46 KB | 434 downloads
No guts, no glory
 
 
  • Post #122
  • Quote
  • Jun 15, 2015 5:33am Jun 15, 2015 5:33am
  •  abokwaik
  • Joined Sep 2012 | Status: No guts, no glory | 3,624 Posts
Quoting pedma
Disliked
{quote} Hi Abokwaik, i do not understand the second blue arrow from the left. I think its open price is taken by the next candle, at above this we can see the third blue candle from the left. Do i miss some thing? And the candle number 5 in the yellow box is the candle for HVC? Thanks
Ignored
You are right pedma, good notice

Actually this version of LVC_Detector is using High/Low not Open. If you check the same chart I had put High in parentheses in my yellow note.
No guts, no glory
 
 
  • Post #123
  • Quote
  • Jun 15, 2015 5:39am Jun 15, 2015 5:39am
  •  Mingary
  • Joined Mar 2011 | Status: I should be on your ignore list | 5,595 Posts
Quoting abokwaik
Disliked
{quote} I don't see the LVC arrows on you chart, It seems you don't have Wingdings font installed. I've attached one for you, download, unzip and copy to ...Windows/Fonts Folder. I think you're saying that it would a good time to sell when volume decreases on rallies, and buy when volume decreases on pullbacks. Please correct me if I misunderstood. {file}
Ignored
Hi,

Indeed, this is what I mean.
 
 
  • Post #124
  • Quote
  • Jun 15, 2015 5:48am Jun 15, 2015 5:48am
  •  abokwaik
  • Joined Sep 2012 | Status: No guts, no glory | 3,624 Posts
Quoting Mingary
Disliked
{quote} Hi, Indeed, this is what I mean.
Ignored
That could be a valid entry criteria. And can be considered as one of the entry options for the system.

So far we were/are discussing LVCs as possible areas of exit.
And I had also highlighted the possibility of taking a reverse entry at those areas (after closing the previous entry, as closing a buy==>a sell).

I think we are on the same page Mingary
No guts, no glory
 
 
  • Post #125
  • Quote
  • Jun 15, 2015 9:27am Jun 15, 2015 9:27am
  •  abokwaik
  • Joined Sep 2012 | Status: No guts, no glory | 3,624 Posts
I found a bug in 1st version of the LVC_Detector.

This chart with old version (1) attached. WRONG

Attached Image (click to enlarge)
Click to Enlarge

Name: EURUSDM15_Wrong.png
Size: 63 KB


This is the same chart with modified version (2). CORRECT

Attached Image (click to enlarge)
Click to Enlarge

Name: EURUSDM15_Right.png
Size: 62 KB


And here is the fixed version

Attached File(s)
File Type: ex4 LVC_Detector_02.ex4   8 KB | 579 downloads


My apologies
No guts, no glory
 
 
  • Post #126
  • Quote
  • Edited 10:41am Jun 15, 2015 10:15am | Edited 10:41am
  •  x1810
  • | Joined Aug 2009 | Status: Member | 54 Posts
Just wondering, ever tried drawing candles using equal volume sizes?
I tried it once in MATLAB. Had tick data, got Matlab to draw bars of equal volume (by tick). It was an interesting perspective to say the least, not that I've done anything with it. Wondering if you have any thoughts about that.
 
 
  • Post #127
  • Quote
  • Jun 15, 2015 10:40am Jun 15, 2015 10:40am
  •  dagoods
  • Joined Nov 2007 | Status: Member | 3,032 Posts
Quoting Magix
Disliked
{quote} Very interesting idea, nothing that I've come across...
Ignored

not too difficult i think to trade with that kind of indicator considering versions of the indicator already exits and just needs code so that mas to be applied to bears only and bulls only. why should it be easy. entries would be easy then and also based on volume in a logical manner. perfect compliment for need 4 speed also perhaps

https://www.mql5.com/en/code/7434 anyone? anyone? buehler?

http://forum.mql4.com/19559
 
 
  • Post #128
  • Quote
  • Jun 15, 2015 10:57am Jun 15, 2015 10:57am
  •  TechFx
  • | Joined Dec 2014 | Status: Member | 49 Posts
Quoting abokwaik
Disliked
I found a bug in 1st version of the LVC_Detector. This chart with old version (1) attached. WRONG {image} This is the same chart with modified version (2). CORRECT {image} And here is the fixed version {file} My apologies
Ignored
interesting...

I have downloaded this and placed it in the experts folder.

However, i see no previous arrows. will this paint it when the setup occurs i.e. no history arrows?
 
 
  • Post #129
  • Quote
  • Jun 15, 2015 11:13am Jun 15, 2015 11:13am
  •  falanca
  • Joined Sep 2007 | Status: Member | 350 Posts
Quoting abokwaik
Disliked
I found a bug in 1st version of the LVC_Detector. This chart with old version (1) attached. WRONG {image} This is the same chart with modified version (2). CORRECT {image} And here is the fixed version {file} My apologies
Ignored
Sir Can we use this indi as the filtration for openning order on automated Dashboard trading after asking GVC and Dingdong
 
 
  • Post #130
  • Quote
  • Jun 15, 2015 11:22am Jun 15, 2015 11:22am
  •  abokwaik
  • Joined Sep 2012 | Status: No guts, no glory | 3,624 Posts
Quoting TechFx
Disliked
{quote} interesting... I have downloaded this and placed it in the experts folder. However, i see no previous arrows. will this paint it when the setup occurs i.e. no history arrows?
Ignored
It's an indicator goes under indicators folder.
No guts, no glory
 
 
  • Post #131
  • Quote
  • Jun 15, 2015 11:30am Jun 15, 2015 11:30am
  •  TechFx
  • | Joined Dec 2014 | Status: Member | 49 Posts
Quoting abokwaik
Disliked
{quote} It's an indicator goes under indicators folder.
Ignored
ah, doh!!. thanks
 
 
  • Post #132
  • Quote
  • Jun 15, 2015 11:51am Jun 15, 2015 11:51am
  •  doerpn
  • | Joined Mar 2014 | Status: MEMBER | 742 Posts
Quoting hukam
Disliked
{quote} LVC detector:- i have tested personally on all pairs, all pairs following it. if you would like to use it on daily above tfs reduce the number of history bars upto 100 instead of 1000. Regards, hukam
Ignored
Hello hucam,
thanks for the hint...now with 100 bars of history it works.
Have a nice day
 
 
  • Post #133
  • Quote
  • Jun 16, 2015 12:22am Jun 16, 2015 12:22am
  •  kprsa
  • Joined Feb 2014 | Status: ember | 1,268 Posts
Quoting abokwaik
Disliked
{quote} Hi kprsa, Nice to see you here. HVCs would usually appear at: - Red News : Some times creating a Gap : which is some sort of LVC, actually a ZVC (Zero Volume Candle), not quite a candle on regular time frames, but rather a Zero Volume Area with time length in milliseconds. LVC should also take care of those ZVCs, as most probably they will get filled later. - Bounce off Support/Resistance Areas : In this case entry on second failed try is usually better than entry on first touch (as we still don't know if it will bounce or break the area)....
Ignored
Thanks, I'll play with these concepts a bit.
Cheers,
k
 
 
  • Post #134
  • Quote
  • Jun 16, 2015 12:58am Jun 16, 2015 12:58am
  •  hukam
  • Joined Mar 2012 | Status: Member | 1,222 Posts
Quoting kprsa
Disliked
{quote} Thanks, I'll play with these concepts a bit. Cheers, k
Ignored
if you find time, merge this concept with TZ zones.
and try on 15min TF all pairs.

regards

Hukam
 
 
  • Post #135
  • Quote
  • Jun 16, 2015 1:09pm Jun 16, 2015 1:09pm
  •  doerpn
  • | Joined Mar 2014 | Status: MEMBER | 742 Posts
Hello guys,
I made some tests on higher TFs and as my broker opens the week on sunday 23:00 there is only 1 hour trading time and therefore low volume when looking at daily timeframe.....see screen please. I am using an indi which marks all the sundays in the chart (white vertical sign). As shown on the EURUSD chart all the signals produced by LVC_Detector occur on sundays......
Now I`m wondering if it wouldn`t be better to fight back this sunday opening as it might falsify the results.
What do you think?
Attached Image (click to enlarge)
Click to Enlarge

Name: sunday-signals.png
Size: 76 KB
Have a nice day
 
 
  • Post #136
  • Quote
  • Jun 16, 2015 2:00pm Jun 16, 2015 2:00pm
  •  abokwaik
  • Joined Sep 2012 | Status: No guts, no glory | 3,624 Posts
Quoting doerpn
Disliked
Hello guys, I made some tests on higher TFs and as my broker opens the week on sunday 23:00 there is only 1 hour trading time and therefore low volume when looking at daily timeframe.....see screen please. I am using an indi which marks all the sundays in the chart (white vertical sign). As shown on the EURUSD chart all the signals produced by LVC_Detector occur on sundays...... Now I`m wondering if it wouldn`t be better to fight back this sunday opening as it might falsify the results. What do you think? {image}
Ignored
Very valid point doerpn .

My suggested solution to this issue is by considering only the candles with ATR applied to volume greater than a minimum percentage.
No guts, no glory
 
 
  • Post #137
  • Quote
  • Jun 16, 2015 2:38pm Jun 16, 2015 2:38pm
  •  doerpn
  • | Joined Mar 2014 | Status: MEMBER | 742 Posts
Quoting abokwaik
Disliked
{quote} Very valid point doerpn . My suggested solution to this issue is by considering only the candles with ATR applied to volume greater than a minimum percentage.
Ignored
Ok, but wouldn`t this sometimes eliminate true signals?
I thought its possible to code the indi so that sunday signals are eliminated because they appear on sundays (Time-filter?)
Have a nice day
 
 
  • Post #138
  • Quote
  • Edited 10:18pm Jun 16, 2015 10:05pm | Edited 10:18pm
  •  hukam
  • Joined Mar 2012 | Status: Member | 1,222 Posts
Another way to use LVC to find future support and resistance area.
two or more LVC can draw a single line to define a new level.. illustration attached.
i will try to post full manually trade-able system within somedays.


***honesty is your best teacher in life..
Attached Image (click to enlarge)
Click to Enlarge

Name: LVC support and resistance lines.png
Size: 18 KB
 
 
  • Post #139
  • Quote
  • Jun 17, 2015 9:20am Jun 17, 2015 9:20am
  •  tai9127
  • Joined May 2014 | Status: From Taiwan Not ROC | 404 Posts
Quoting doerpn
Disliked
Hello guys, I made some tests on higher TFs and as my broker opens the week on sunday 23:00 there is only 1 hour trading time and therefore low volume when looking at daily timeframe.....see screen please. I am using an indi which marks all the sundays in the chart (white vertical sign). As shown on the EURUSD chart all the signals produced by LVC_Detector occur on sundays...... Now I`m wondering if it wouldn`t be better to fight back this sunday opening as it might falsify the results. What do you think? {image}
Ignored
what's you setting that can show like yours?
Everyone can find their HolyGrail
New Balance All Time Return: 46.8%
 
 
  • Post #140
  • Quote
  • Edited 10:42am Jun 17, 2015 9:59am | Edited 10:42am
  •  hukam
  • Joined Mar 2012 | Status: Member | 1,222 Posts
Quoting hukam
Disliked
Another way to use LVC to find future support and resistance area. two or more LVC can draw a single line to define a new level.. illustration attached. i will try to post full manually trade-able system within somedays. ***honesty is your best teacher in life.. {image}
Ignored
LVC S/R
target hit less than 2min
next LVC target from 5min TF (LVC SR2 illustration) second target hit
Attached Image(s) (click to enlarge)
Click to Enlarge

Name: LVC SR.png
Size: 45 KB
Click to Enlarge

Name: LVC SR 1.png
Size: 28 KB
Click to Enlarge

Name: LVC SR 2.png
Size: 56 KB
Click to Enlarge

Name: LVC SR 3.png
Size: 49 KB
 
 
  • Trading Discussion
  • /
  • Low Volume Candles
  • Reply to Thread
    • 1 56Page 789 18
    • 1 6Page 78 18
0 traders viewing now
  • More
Top of Page
  • Facebook
  • Twitter
About FF
  • Mission
  • Products
  • User Guide
  • Media Kit
  • Blog
  • Contact
FF Products
  • Forums
  • Trades
  • Calendar
  • News
  • Market
  • Brokers
  • Trade Explorer
FF Website
  • Homepage
  • Search
  • Members
  • Report a Bug
Follow FF
  • Facebook
  • Twitter

FF Sister Sites:

  • Metals Mine
  • Energy EXCH
  • Crypto Craft

Forex Factory® is a brand of Fair Economy, Inc.

Terms of Service / ©2023