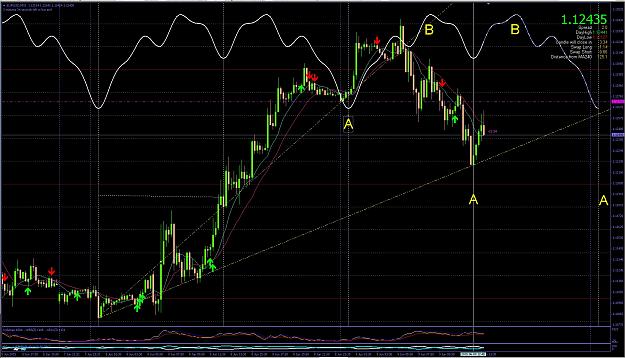
It always seems impossible until it's done...!!!
M candles / Custom candles for second charts 1 reply
How to select last four candles with Highest price or Volume? 8 replies
Bull & bear candles volume counter 4 replies
Consecutive candles indi combined with volume & spread indi 13 replies
Disliked{quote} To be honest, I'm in doubt if there is any relationship between future price and history price of low volume. Why not develop an EA to test your strategy?Ignored
DislikedHello abokwaik. The input signals of this new indicator are very good. You can put in a new version of this indicator alarms sound and the window with the alert message. Thanks in advance.Ignored
Disliked{quote} Hi headfake, I assume that you know that I was describing the Target Candle (Not the entry candle ... which we haven't describe yet). So I the Bullish Candle is the Target (= Exit) for a future Short Entry, its by definition a prospect Long Entry Candle, As Short Exit = Long Entry. I would like to know more about your experience on the subject. Have a nice day, KhalilIgnored
DislikedEA part I - don't laugh its serious issue. if you understand it please give your further contribution on it. ... .. Regards Hukam {image}Ignored
DislikedHello abokwaik. The input signals of this new indicator are very good. You can put in a new version of this indicator alarms sound and the window with the alert message. Thanks in advance.Ignored
Disliked{quote} Hi fuenwood, It seems to me that you misunderstood the concept. Those arrows are Potential EXIT points not ENTRY Points. Still, alert can be useful to watch out for those potential exit points for possible Future Entries. Regards, KhalilIgnored
DislikedI've quickly made a Low Volume Candle Detector Indicator. Kindly test and report your thoughts. {image} Inputs : - History Bars : Number of Indicator Bars - Loop Back Bars : Number of Bars to check for Lowest Volume - Future Bars : Number of Bars before Open or Close got hit for a Valid LVC Red Arrows Represent Potential Targets for Short Entries above. Blue Arrows Represent Potential Targets for Long Entries below. In the above chart all entries against valid LVCs would have reached their target. Now for the golden question : What would be the...Ignored
Disliked{quote} Hello, I'm testing this indicator and I like it, if possible please add an alert like a message and sound. Thanks a lot Best regardsIgnored
Disliked{quote} it's martingale reactor pattern, our fuel is money. part II is ready nothing hard but i want to make sure everything understandable and works well together in real practical & math worlds.Ignored
Disliked{quote} So your idea is to hedge/martingale a loosing trade which didn't reach its LVC, with a new trade in the opposite direction targeting an older LVC. Why not close the loosing trade with a pre-defined (R:R) and start a new trade in the other direction. I am still not clear about entry criteria, but I assume that we will be trading reversals targeting LVCs, so which techniques you might have used for reversals (Candle Stick Formations, An Opposite LVC, Bounces off Standard S/R lines, Fibos, Trend Channel Boundaries, BB, Pivots ...) Waiting for...Ignored