• Home
  • Forums
  • Trades
  • News
  • Calendar
  • Market
  • Brokers
  • Login
  • Join
  • User/Email: Password:
  • 1:16am
Menu
  • Forums
  • Trades
  • News
  • Calendar
  • Market
  • Brokers
  • Login
  • Join
  • 1:16am
Sister Sites
  • Metals Mine
  • Energy EXCH
  • Crypto Craft

Options

Bookmark Thread

First Page First Unread Last Page Last Post

Print Thread

Similar Threads

VSA-divergence trading 187 replies

How to Blow $200 account using VSA--- 594 replies

VSA Journal 57 replies

VSA broker history change datas 11 replies

  • Interactive Trading
  • /
  • Reply to Thread
  • Subscribe
  • 12,339
Attachments: vsa with Malcolm
Exit Attachments
Tags: vsa with Malcolm
Cancel

vsa with Malcolm

  • Last Post
  •  
  • 1 13391340Page 134113421343 1803
  • 1 Page 1341 1803
  •  
  • Post #26,801
  • Quote
  • May 30, 2015 7:56am May 30, 2015 7:56am
  •  classix
  • | Joined Jan 2014 | Status: Member | 158 Posts
Quoting SimpleDev
Disliked
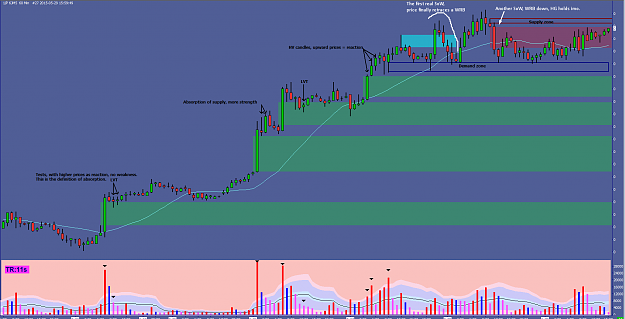
{quote} You have to watch and see how price reacts to SOS/SOW. Does the next bar confirm the SOS? Is price staying above or below the SOS? Are the test succeeding or failing? Is price trending up? Down? Or sideways? That AU chart has a SOW (described in black wording) and Absorption volume (in white wording) {image}
Ignored
thanks for detailed answer..removed lots of misunderstandings.
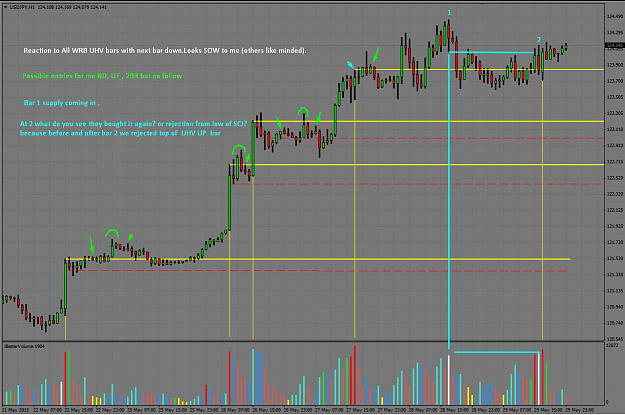
to me on chart i posted it looks like still bullish..if i followed you correctly.. because we are above UHV up bar and also above bar no 2 close and seen a test recently.. right??..kindly review that
Attached Image (click to enlarge)
Click to Enlarge

Name: Screenshot_3.png
Size: 121 KB
Think Twice Low Volume is Key to Success
 
 
  • Post #26,802
  • Quote
  • May 30, 2015 2:20pm May 30, 2015 2:20pm
  •  LO-Trader
  • | Joined Nov 2012 | Status: Practitioner of Uncertainty | 213 Posts
Hello,

I took a chart trying to find out why the absorption volume failed once and succeed in the other.

First setup which failed
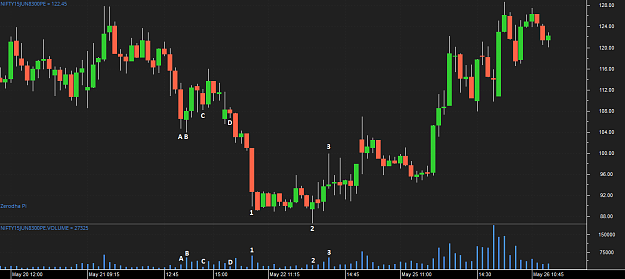
A : Down candle with high volume. Cannot be considers as selling climatic because volume is not very high.
B : This candle shows buying happened in this candle and previous candle.
C : very low volume in a down candle. this can be considered as NS or test. This candle is SOS.
D : This is again NS which is SOS. But suddenly next candle was down with high voulume.
Is there something which I missed?

Second setup which succeeded
1: Selling climax. bar failed to close low with high volume. This shows strength
2: This makes lower low but with low volume. Shows that there are very less sellers.
3: This bar tired to make higher high, but supply swamping demand. Market has to come down and remove the floating supply before it goes high.
Next few bars tried to make lower low but they all closed at the higher portion of the candle. This shows there is no more supply left in the market.

Please let me know my understanding is correct.

Attached Image (click to enlarge)
Click to Enlarge

Name: NIFTYPE.png
Size: 26 KB


Thanks,
LO-Trader
 
 
  • Post #26,803
  • Quote
  • May 30, 2015 4:46pm May 30, 2015 4:46pm
  •  hieronymus
  • Joined Apr 2015 | Status: Member | 542 Posts
Quoting classix
Disliked
{quote} because we are above UHV up bar and also above bar no 2 close and seen a test recently.. right??..kindly review that {image}
Ignored
You know my style, here's my 2 cents. Barely any weakness until that top at all. Your candle no.1 is a down bar so it can't be supply coming in, that would have to be an up bar.
1h
Attached Image (click to enlarge)
Click to Enlarge

Name: Image1.png
Size: 56 KB
 
 
  • Post #26,804
  • Quote
  • Edited 10:17pm May 30, 2015 6:29pm | Edited 10:17pm
  •  hieronymus
  • Joined Apr 2015 | Status: Member | 542 Posts
Quoting LO-Trader
Disliked
Hello, I took a chart trying to find out why the absorption volume failed once and succeed in the other. First setup which failed A : Down candle with high volume. Cannot be considers as selling climatic because volume is not very high. B : This candle shows buying happened in this candle and previous candle. C : very low volume in a down candle. this can be considered as NS or test. This candle is SOS. D : This is again NS which is SOS. But suddenly next candle was down with high voulume. Is there something which I missed?
Ignored
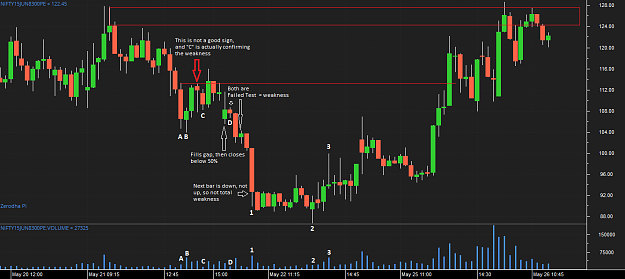
ND and NS are not really a SOS or SOW until the next interval proves it. So, they are failed tests based on the price action. What time frame is this, daily? It has the oddest volume I've seen.
Attached Image (click to enlarge)
Click to Enlarge

Name: 11.png
Size: 34 KB
 
 
  • Post #26,805
  • Quote
  • May 31, 2015 9:40pm May 31, 2015 9:40pm
  •  SimpleDev
  • Joined Apr 2010 | Status: Retired | 575 Posts
Quoting classix
Disliked
{quote} to me on chart i posted it looks like still bullish..
Ignored
For the most part you are on the right track..

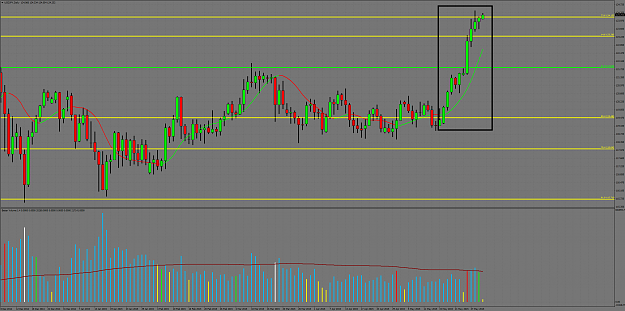
But, look at this daily chart.

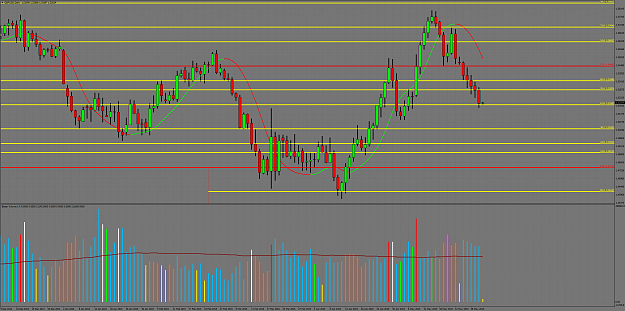
Do you see how just about every bar since May 15th is making a higher high and a higher low?

Now go back to your possible short entries on 1h and see if you still want to fight that aggressive daily trend. Daily charts are important to watch for intraday traders.
Attached Image (click to enlarge)
Click to Enlarge

Name: USDJPYDaily.png
Size: 80 KB
 
 
  • Post #26,806
  • Quote
  • Jun 1, 2015 12:38am Jun 1, 2015 12:38am
  •  LO-Trader
  • | Joined Nov 2012 | Status: Practitioner of Uncertainty | 213 Posts
Quoting hieronymus
Disliked
{quote} ND and NS are not really a SOS or SOW until the next interval proves it. So, they are failed tests based on the price action. What time frame is this, daily? It has the oddest volume I've seen. {image}
Ignored
Thanks Hieronymus for reply. The charts is M15 timer frame.
I got your points about NS and ND. Read it many times here before, but could not recollect during my analysis. thanks for pointing it out again.

I still got few doubt about the candle you marked with red arrow.
You mentioned that "This is not a good sign, and C is actually confirming the weakness".
The candle(previous to candle C) was pushed down but failed to close low. The close can be high only because buyers came in. Rite? And C is having very low volume on a down bar. So this signifies NS. or BBs are not interested in lower prices. And next bar after C was up which confirms that.

Please let me know what I m missing.

Thanks,
LO-Trader
 
 
  • Post #26,807
  • Quote
  • Jun 1, 2015 1:09am Jun 1, 2015 1:09am
  •  SimpleDev
  • Joined Apr 2010 | Status: Retired | 575 Posts
Quoting LO-Trader
Disliked
{quote} Thanks Hieronymus for reply. The charts is M15 timer frame. I got your points about NS and ND. Read it many times here before, but could not recollect during my analysis. thanks for pointing it out again. I still got few doubt about the candle you marked with red arrow. You mentioned that "This is not a good sign, and C is actually confirming the weakness". The candle(previous to candle C) was pushed down but failed to close low. The close can be high only because buyers came in. Rite? And C is having very low volume on a down bar. So this...
Ignored
I am sure Hiero can still explain his thinking behind the bar with the red arrow and bar C.

First you have to be careful with the Indian exchange, the volumes are different, they don't look right.

Second is look at bar C, what is it testing? Its in the middle of your bar A. Now look at bar D, do you see how its testing the close of bar A? Look at the result of bar D, the next bar is down showing that price is still weak.

Finally take a look 6 bars to the right of bar 1. See how that test is testing the low of bar 1 and see how the next bar is up showing how price is no longer weak.
 
 
  • Post #26,808
  • Quote
  • Edited 2:30pm Jun 1, 2015 9:29am | Edited 2:30pm
  •  hieronymus
  • Joined Apr 2015 | Status: Member | 542 Posts
Quoting LO-Trader
Disliked
{quote} Thanks Hieronymus for reply. The charts is M15 timer frame. I got your points about NS and ND. Read it many times here before, but could not recollect during my analysis. thanks for pointing it out again. I still got few doubt about the candle you marked with red arrow. You mentioned that "This is not a good sign, and C is actually confirming the weakness". The candle(previous to candle C) was pushed down but failed to close low. The close can be high only because buyers came in. Rite? And C is having very low volume on a down bar. So this...
Ignored
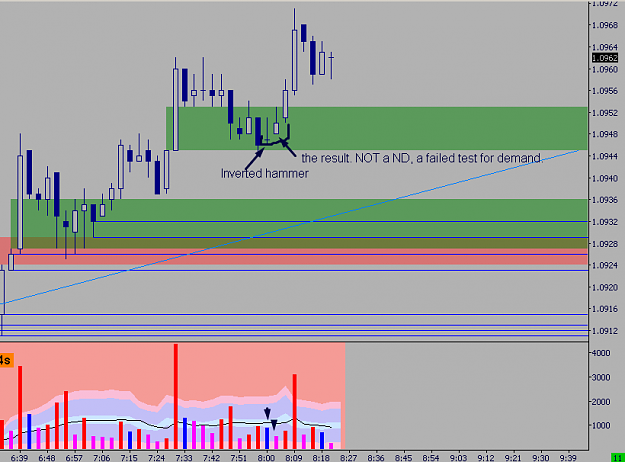
Whatever that chart is (Indian Exchange?) I wouldn't trade it, it looks like a rigged carnival game, if that analogy makes any sense. Anyway the candle before C has the potential to be a few things, a hangman or a test for supply or I suppose a type of hammer (the volume would have to be very high on it though and price heading north afterwards). That's getting into my weirder PA, lets stick with a test. The candle tested for supply and the result was a down candle, candle "C". Candle "C" had low volume and the general shape of a NS but it's just never a good sign when a test fails. This was happening within a hidden gap and the next candle is like an odd upthrust out of the HG, closing back below it next candle.


Here is a chart of the same thing happening but basically the opposite, it may help understand it, or just confuse the matter more. Instead of a hangman shaped candle, we have a inverted hammer shaped candle (both result in what looks to some vsa traders as a NS/ND respectively. They are in reality results of tests prior to them, and price action should really be watched to see what happens afterwards. Depending on volume you can think of a hangman as a low/high volume test and the same with inverted hammer. To go one step further, that result from the inverted hammer happens to be itself a failed test next candle after that, even more sign of higher prices.
Attached Image (click to enlarge)
Click to Enlarge

Name: 8.png
Size: 30 KB


Edit: Also, if you see in my thread, today we have the opposite reaction to a hangman looking candle on the 1h E/U. You can see how to trade these or understand the price action now, by seeing how the results differ, based on volume/position/next candle.
 
 
  • Post #26,809
  • Quote
  • Jun 1, 2015 11:14am Jun 1, 2015 11:14am
  •  LO-Trader
  • | Joined Nov 2012 | Status: Practitioner of Uncertainty | 213 Posts
Quoting SimpleDev
Disliked
{quote} I am sure Hiero can still explain his thinking behind the bar with the red arrow and bar C. First you have to be careful with the Indian exchange, the volumes are different, they don't look right.
Ignored
Quoting hieronymus
Disliked
{quote} Whatever that chart is (Indian Exchange?) I wouldn't trade it, it looks like a rigged carnival game, if that analogy makes any sense.
Ignored
Thanks SimpleDev and Hiero for detailed explanation.
In my country trading forex is illegal. So I have to stick with stocks, FnO. I m just wondering why the volume looks odd. It should be the same way with all the markets. BB footprints should be same in every market. Isn't? So I m bit confused about how to proceed. Shall i look for other instruments which follows volume. As a newbie, with my limited understanding with VSA I m finding it difficult to figure out the rite instrument. Your advice will be of great help.

Thanks,
LO-Trader
 
 
  • Post #26,810
  • Quote
  • Jun 1, 2015 11:32am Jun 1, 2015 11:32am
  •  hieronymus
  • Joined Apr 2015 | Status: Member | 542 Posts
Quoting LO-Trader
Disliked
{quote} {quote} Thanks SimpleDev and Hiero for detailed explanation. In my country trading forex is illegal. So I have to stick with stocks, FnO. I m just wondering why the volume looks odd. It should be the same way with all the markets. BB footprints should be same in every market. Isn't? So I m bit confused about how to proceed. Shall i look for other instruments which follows volume. As a newbie, with my limited understanding with VSA I m finding it difficult to figure out the rite instrument. Your advice will be of great help. Thanks, LO-Trader...
Ignored
I haven't traded for more than a year yet so I'd say I'm still a newbie as well. I can't really articulate why that price action and volume are weird but they just are. Honestly I've never cared to look at stock charts, so maybe the price action and volume are normal for stock stuff. Can you trade futures in your country? If you can, that would be my advice.
 
 
  • Post #26,811
  • Quote
  • Jun 1, 2015 12:11pm Jun 1, 2015 12:11pm
  •  LO-Trader
  • | Joined Nov 2012 | Status: Practitioner of Uncertainty | 213 Posts
Quoting hieronymus
Disliked
{quote} I haven't traded for more than a year yet so I'd say I'm still a newbie as well. I can't really articulate why that price action and volume are weird but they just are. Honestly I've never cared to look at stock charts, so maybe the price action and volume are normal for stock stuff. Can you trade futures in your country? If you can, that would be my advice.
Ignored
Thank you very much.
 
 
  • Post #26,812
  • Quote
  • Jun 1, 2015 9:32pm Jun 1, 2015 9:32pm
  •  SimpleDev
  • Joined Apr 2010 | Status: Retired | 575 Posts
Quoting LO-Trader
Disliked
{quote} {quote} In my country trading forex is illegal.
Ignored
I am heavily biased against stocks in India. There are have been a number of people who have posted charts of stocks in this thread and so far Ive only seen stocks that price was heavily manipulated.

The charts would have these massive massive shakeouts on very small volume. Nifty is an index yes? You might be ok, since it should be heavily traded, you really have to stick with the heavily traded stocks and indexes where it is harder to manipulate price.

What bothers me about your chart is compare the volume on May 20th to the volume May 25th. The volume on May 20th is basically unreadable because its so low compared to May 25th. Was May 20th a holiday and no one was trading?

There are valid setups on May 21st with the selling at top of the chart as well as May 22nd at the bottom. My advice is to be very careful, paper trade as much as you can and when you go live to do so with money you wont miss if you loss it.
 
 
  • Post #26,813
  • Quote
  • Jun 1, 2015 9:37pm Jun 1, 2015 9:37pm
  •  SimpleDev
  • Joined Apr 2010 | Status: Retired | 575 Posts
You have to love these trending markets.

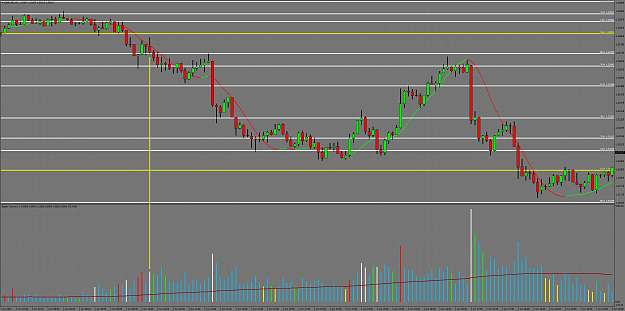
Look at daily of GU, lower lows and lower highs.


5m chart, 10 minutes after LO. Hulls is down, this high volume bars tries to go above the previous bar but fails and closes on the low. The next bars closes down to confirm the weakness.
Attached Image(s) (click to enlarge)
Click to Enlarge

Name: GBPUSDDaily.png
Size: 167 KB
Click to Enlarge

Name: GBPUSDM5.png
Size: 83 KB
 
 
  • Post #26,814
  • Quote
  • Jun 1, 2015 11:14pm Jun 1, 2015 11:14pm
  •  LO-Trader
  • | Joined Nov 2012 | Status: Practitioner of Uncertainty | 213 Posts
Quoting SimpleDev
Disliked
{quote} I am heavily biased against stocks in India. There are have been a number of people who have posted charts of stocks in this thread and so far Ive only seen stocks that price was heavily manipulated. The charts would have these massive massive shakeouts on very small volume. Nifty is an index yes? You might be ok, since it should be heavily traded, you really have to stick with the heavily traded stocks and indexes where it is harder to manipulate price.
Ignored
Point taken. I ll try to find out heavily traded instruments and see how it goes. One suggestion from Hiero was to trade futures, since there is only one NIFTY futures, unlike many options contracts, it should have heavy volume and is not easy to manipulate.

Quoting SimpleDev
Disliked
{quote} What bothers me about your chart is compare the volume on May 20th to the volume May 25th. The volume on May 20th is basically unreadable because its so low compared to May 25th. Was May 20th a holiday and no one was trading? There are valid setups on May 21st with the selling at top of the chart as well as May 22nd at the bottom. My advice is to be very careful, paper trade as much as you can and when you go live to do so with money you wont miss if you loss it.
Ignored
The chart I posted was a NIFTY option chart which expires on June 25. One reason why the volume was so low on May 20th and it grew as it approaches to May 25th is because of the March option contract expiring soon(on May 28th) and people start preferring June contract.

Thank you guys once again for your time and effort. Moreover a mind to help.

LO-Trader
 
 
  • Post #26,815
  • Quote
  • Jun 2, 2015 12:05am Jun 2, 2015 12:05am
  •  hieronymus
  • Joined Apr 2015 | Status: Member | 542 Posts
Quoting LO-Trader
Disliked
{quote} Point taken. I ll try to find out heavily traded instruments and see how it goes. One suggestion from Hiero was to trade futures, since there is only one NIFTY futures, unlike many options contracts, it should have heavy volume and is not easy to manipulate. {quote} The chart I posted was a NIFTY option chart which expires on June 25. One reason why the volume was so low on May 20th and it grew as it approaches to May 25th is because of the March option contract expiring soon(on May 28th) and people start preferring June contract. Thank...
Ignored
Ok this makes a lot more sense why that was a weird chart now.I know nothing of options, but are you able to show a continuous contract by chance?
 
 
  • Post #26,816
  • Quote
  • Jun 2, 2015 2:01am Jun 2, 2015 2:01am
  •  LO-Trader
  • | Joined Nov 2012 | Status: Practitioner of Uncertainty | 213 Posts
Looks like the the markets participation is very uneven. There is sudden surge in one candle and no activity for so long.
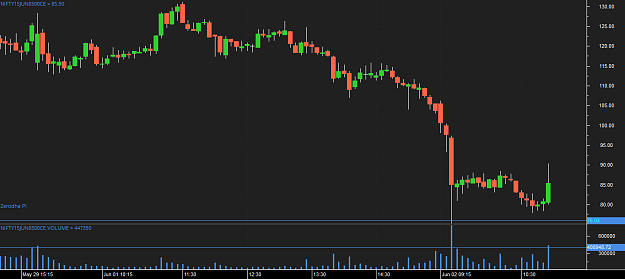
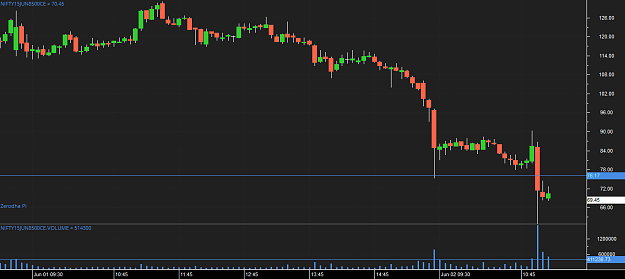
Below is the M5 chart for NIFTY june options contract. This is the NIFTY option contract with most volume i could find at this point of time. Chart looks good for sometime as shown below.
Attached Image (click to enlarge)
Click to Enlarge

Name: NIFTYPE.png
Size: 30 KB


But suddenly heavy volume and price spread in next candle. Making all the previous volumes looks so small. And this happens quite often.


Attached Image (click to enlarge)
Click to Enlarge

Name: surgeinvolume.png
Size: 27 KB


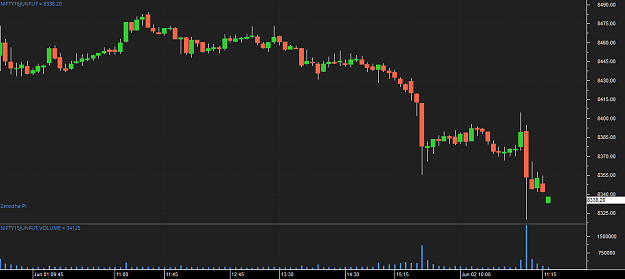
This how the June future contract looks. Again this is the future contract with most volume.

Attached Image (click to enlarge)
Click to Enlarge

Name: junefuture.png
Size: 29 KB


Thanks,
LO-Trader
 
 
  • Post #26,817
  • Quote
  • Jun 2, 2015 2:51am Jun 2, 2015 2:51am
  •  SimpleDev
  • Joined Apr 2010 | Status: Retired | 575 Posts
Quoting LO-Trader
Disliked
Looks like the the markets participation is very uneven. There is sudden surge in one candle and no activity for so long. Below is the M5 chart for NIFTY june options contract. This is the NIFTY option contract with most volume i could find at this point of time. Chart looks good for sometime as shown below. {image} But suddenly heavy volume and price spread in next candle. Making all the previous volumes looks so small. And this happens quite often. {image} This how the June future contract looks. Again this is the future contract with most volume....
Ignored
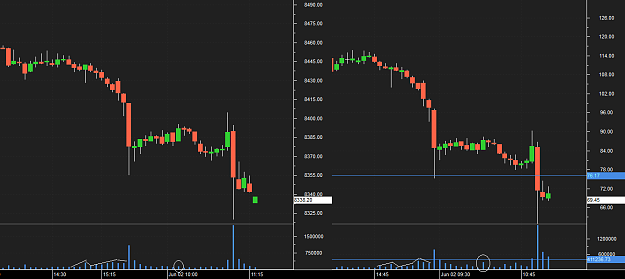
I am assuming you are looking at different contracts? The first 2 screen shots say NIFTY15JUN8500CE, the 3rd one says NIFTY15JUNFUT.

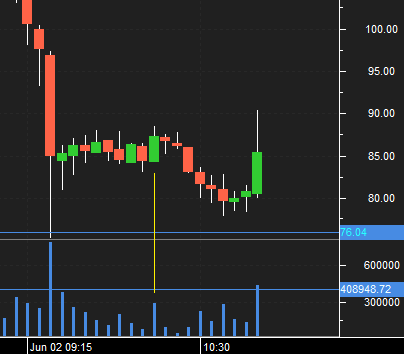
The volume on 8500CE looks good. The FUT is bad. The bar I marked in yellow is the tip off.

You had stopping volume, bar 1 is a successful test then bar 2 is a failed test. Bar 3 is another successful test, but look at that up bar (yellow) that volume is really high compared to the volume on the test bar 3. You can really see how high it is on your first screenshot.

Bar 4 is another failed test and price comes off. I am guess that higher timeframes like 1h or daily are in a downtrend.

Side note, your last screen shot, I would have shorted that last down bar, that down bar is confirming the previous up bar as a ND. Price keeps pushing down, and that last bar with the stopping volume the next bar closed down making me think selling is going on.
Attached Image (click to enlarge)
Click to Enlarge

Name: surgeinvolume.png
Size: 25 KB
 
 
  • Post #26,818
  • Quote
  • Jun 2, 2015 2:57am Jun 2, 2015 2:57am
  •  SimpleDev
  • Joined Apr 2010 | Status: Retired | 575 Posts
A lot of differences, like I said you have to be really careful.
Attached Image (click to enlarge)
Click to Enlarge

Name: surgeinvolume (1).png
Size: 28 KB
 
 
  • Post #26,819
  • Quote
  • Jun 2, 2015 11:52am Jun 2, 2015 11:52am
  •  LO-Trader
  • | Joined Nov 2012 | Status: Practitioner of Uncertainty | 213 Posts
Quoting SimpleDev
Disliked
{quote} I am assuming you are looking at different contracts? The first 2 screen shots say NIFTY15JUN8500CE, the 3rd one says NIFTY15JUNFUT. The volume on 8500CE looks good. The FUT is bad. The bar I marked in yellow is the tip off. You had stopping volume, bar 1 is a successful test then bar 2 is a failed test. Bar 3 is another successful test, but look at that up bar (yellow) that volume is really high compared to the volume on the test bar 3. You can really see how high it is on your first screenshot.
Ignored
Yes the volume on the yellow bar is too high. So there can be hidden selling in this bar. I missed to notice this.
Just inserting chart again for more clarity.
Attached Image


I m happy that you are able to read something from the chart. I was worried about VSA not working on Indian markets.

Thanks,
LO-Trader
 
 
  • Post #26,820
  • Quote
  • Jun 2, 2015 12:03pm Jun 2, 2015 12:03pm
  •  LO-Trader
  • | Joined Nov 2012 | Status: Practitioner of Uncertainty | 213 Posts
Hello Guys,

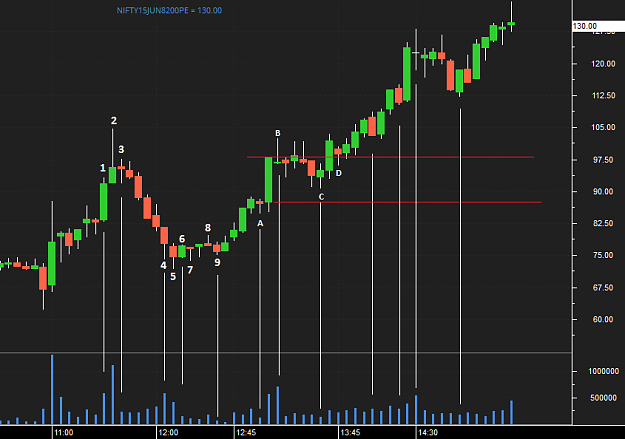
Volume looks to be much better today. Below chart is on M5 time frame. When I look back now I feel like it is following VSA principles.

2: volume was too high and bar closed below 30% of the range. Lot of selling.
4 & 5: looks like stopping volume
6: less volume on a upbar. ND. no sign of going up. But SOS.
7: was a successful test.
8: supply coming back to market.
9: was a successful test as the next bar was up.
A: was a successful test as the next bar was up.
B: supply swamping demand. SOW. But next bar was a successful test.
C: successful test.

Attached Image (click to enlarge)
Click to Enlarge

Name: 8200PE_5M_topost.png
Size: 26 KB


Hope my interpretations are rite.

Thanks,
LO-Trader
 
 
  • Interactive Trading
  • /
  • vsa with Malcolm
  • Reply to Thread
    • 1 13391340Page 134113421343 1803
    • 1 Page 1341 1803
2 traders viewing now, 1 is a member:
Invisible
  • More
Top of Page
  • Facebook
  • Twitter
About FF
  • Mission
  • Products
  • User Guide
  • Media Kit
  • Blog
  • Contact
FF Products
  • Forums
  • Trades
  • Calendar
  • News
  • Market
  • Brokers
  • Trade Explorer
FF Website
  • Homepage
  • Search
  • Members
  • Report a Bug
Follow FF
  • Facebook
  • Twitter

FF Sister Sites:

  • Metals Mine
  • Energy EXCH
  • Crypto Craft

Forex Factory® is a brand of Fair Economy, Inc.

Terms of Service / ©2023