[quote=HiddenGap;8241611] # That's right, it's from the best band ever: Joy Division.[quote]
In agreement, one of them at least, I honestly love New Order just as much.
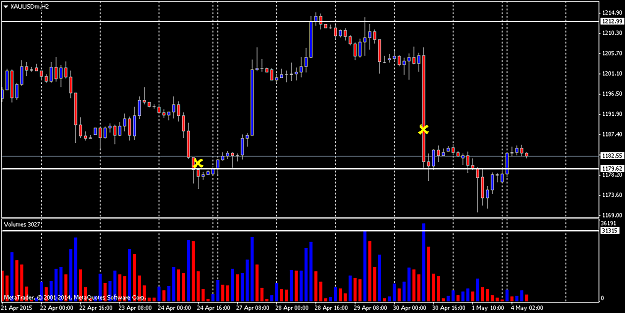
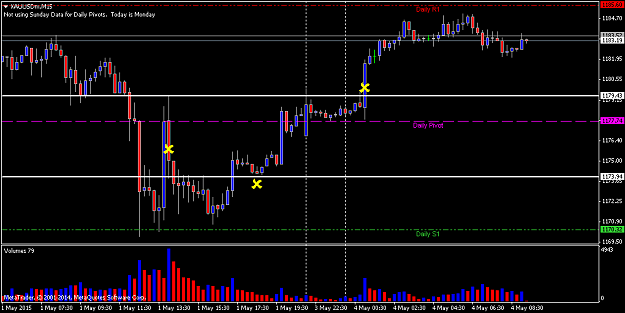
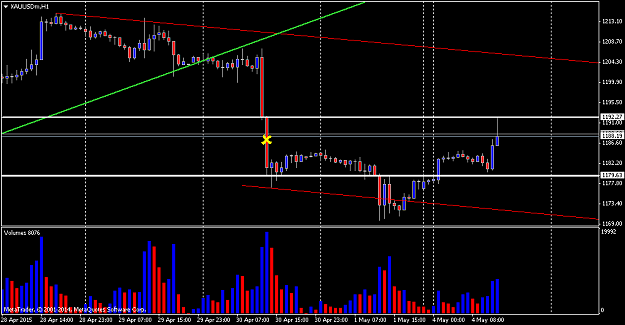
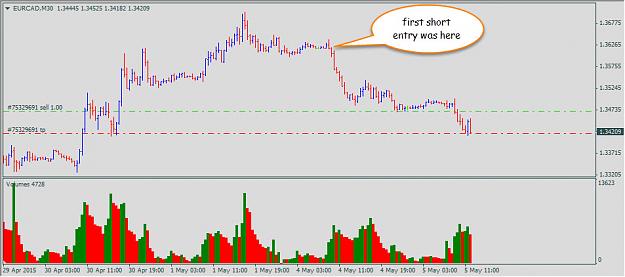
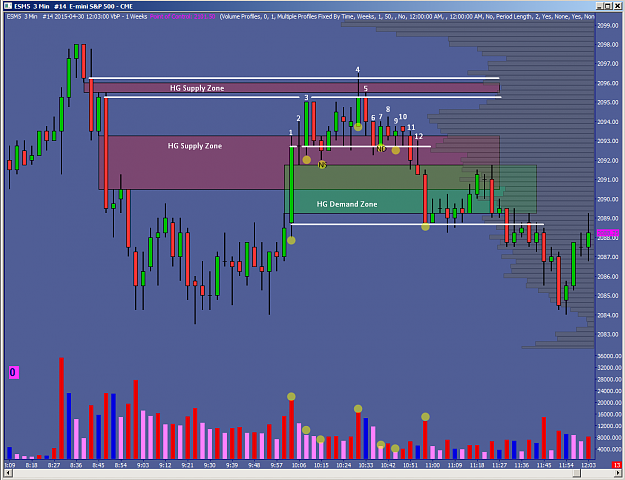
Using the background and zones, I'd like to make another quick analysis:
1. A WRB up candle, that touched the very top of HG. It had very high volume with the result being a doji & then higher price. Price hasn't reached the HG above or the top of the prev WRB down.
2.Doji, it initiated/created a Demand HG and went above the selling HG, closing back where prev WRB closed.
3.Rises on no demand and is taken right back down in next candle, followed by a NS right on the WRDB. There is still no real supply in the area so price travels back up.
The unlabeled candle, 5 candles after #3, is a bearish harami candle which is followed by a bullish harami-like candle (These two aren't much to look into really imo).
This drifting action finally leads to candle:
4. An effort to rise above and out of the WRB and HG zone, and it goes above both, on high volume. Not climactic volume/ultra high, but good UT-like high volume. It's more like an ETR and an UT to me than anything. Very well could have been someone gunning for stops above the gap before bringing it down, or just a searching for supply, that was found.
5&6. Confirms supply has been found and price falls back to WRDB on above avg to high vol, but is stopped, there is still demand.
7.No demand and 8,9,10,11 confirm there is ND left. HG describes them good, except with candle 8(3), I can't see that as even UT-like. It doesn't have the volume or range to be UT-like. Then again I call candle 10 a hangman candle and it doesn't follow the standard hangman definition either. What I can see as UT-like is candle 12. A possible hidden UT before price falls.
So back to background, a most important subject. 8,9,10, and the harami-like candles before candle 4 are sometimes hard to tell wtf is really happening. So what does the background state? 1 and 2 showed there was demand after the jump up, but 4,5, and 6 showed a reasonably strong rejection of higher prices. I sometimes trade very aggressive (depending on a lot of factors, not the least of which is how I'm doing for the day) around HG zones and would honestly have shorted the upper wick of candle 4 with a 3 tick stop (I would also have exited much to early).
While I state my assumptions with confidence, I in no way want to make it seem I know more or have more experience than the old hands in this thread (I started in Oct of 2014) and thank HG for the lesson, and have much anticipation for more charts and teaching.
In agreement, one of them at least, I honestly love New Order just as much.
Using the background and zones, I'd like to make another quick analysis:
1. A WRB up candle, that touched the very top of HG. It had very high volume with the result being a doji & then higher price. Price hasn't reached the HG above or the top of the prev WRB down.
2.Doji, it initiated/created a Demand HG and went above the selling HG, closing back where prev WRB closed.
3.Rises on no demand and is taken right back down in next candle, followed by a NS right on the WRDB. There is still no real supply in the area so price travels back up.
The unlabeled candle, 5 candles after #3, is a bearish harami candle which is followed by a bullish harami-like candle (These two aren't much to look into really imo).
This drifting action finally leads to candle:
4. An effort to rise above and out of the WRB and HG zone, and it goes above both, on high volume. Not climactic volume/ultra high, but good UT-like high volume. It's more like an ETR and an UT to me than anything. Very well could have been someone gunning for stops above the gap before bringing it down, or just a searching for supply, that was found.
5&6. Confirms supply has been found and price falls back to WRDB on above avg to high vol, but is stopped, there is still demand.
7.No demand and 8,9,10,11 confirm there is ND left. HG describes them good, except with candle 8(3), I can't see that as even UT-like. It doesn't have the volume or range to be UT-like. Then again I call candle 10 a hangman candle and it doesn't follow the standard hangman definition either. What I can see as UT-like is candle 12. A possible hidden UT before price falls.
So back to background, a most important subject. 8,9,10, and the harami-like candles before candle 4 are sometimes hard to tell wtf is really happening. So what does the background state? 1 and 2 showed there was demand after the jump up, but 4,5, and 6 showed a reasonably strong rejection of higher prices. I sometimes trade very aggressive (depending on a lot of factors, not the least of which is how I'm doing for the day) around HG zones and would honestly have shorted the upper wick of candle 4 with a 3 tick stop (I would also have exited much to early).
While I state my assumptions with confidence, I in no way want to make it seem I know more or have more experience than the old hands in this thread (I started in Oct of 2014) and thank HG for the lesson, and have much anticipation for more charts and teaching.
Attached Image (click to enlarge)