[quote=infinitus;8238534]{quote} Hmm, looking at the following chart:
What I can look at, it's that when there is a big trend or momentum, the market try to fullfill the gaps that are before the reverse. Sometimes this gaps acts like a border, sometimes the gap must be fullfilled. I do not know the reason, the market acts in this way and when choose one way or the other. Is astonishingly how the markets reacts when touch this gaps or fullfilled them ( specially in hour timeframes )
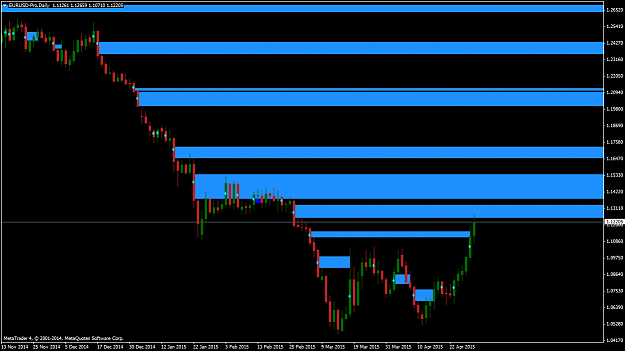
I can see a gap daily/4 hour from the day 26 february, the day when the market broke 1,13-12,70 area. I want to think that at that moment there were a lot of sellers, not interesting in buying, with big volume. Is it going to be a border or it is going to be fullfilled?? Sometimes, to start thinking in shorts, I fell more confident when these big gaps are closed. I hope these charts will help. If fullfilled, suit where you are talking about...
Best Regards,
{quote} Hmm, looking at the following chart: What I can look at, it's that when there is a big trend or momentum, the market try to fullfill the gaps that are before the reverse. Sometimes this gaps acts like a border, sometimes the gap must be fullfilled. I do not know the reason, the market acts in this way and when choose one way or the other. Is astonishingly how the markets reacts when touch this gaps or fullfilled them ( specially in hour timeframes ) I can see a gap daily/4 hour from the day 26 february, the day when
Ignored
...
Ignored
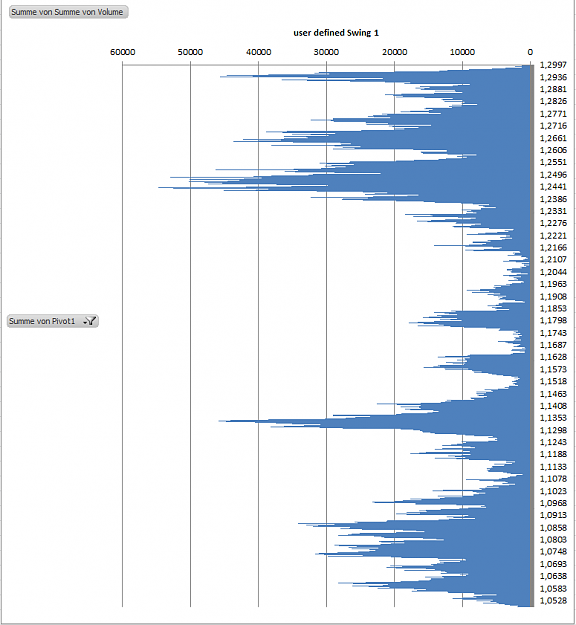
nice chart and indicator
look at the following chart - find the low volume zones and compare to the zones in your indicator
{quote}{quote} nice chart and indicator look at the following chart - find the low volume zones and compare to the zones in your indicator {image}
Ignored
Yes, there were low response from my point of view on 26-feb. Sell-off. But a good option could have been a short today, 12,40-60, because this gap can act as a border. Or it will be fullfilled? Looking it at now, we would be with a s/l at BE. And it can be a very good short. You can think that the big hands that sold on 26-feb are still there, and then it's going to be a border, or if they have changed, it will be fullfilled.
{quote}{quote} nice chart and indicator look at the following chart - find the low volume zones and compare to the zones in your indicator {image}
Ignored
To both of you while this volume analisis looks nice and works too, its no need to complicate it that much. Supply and demand picture tells exactly what volume analisis says. You dont even need volume numbers and you can plot pretty much most of those zones in few seconds on. PA tells you where important battles are taken, and also where low volume battles were taken, for low volume battle i always compare leg to leg (left to right ) to get rejections. Results are the same, but 10 times less work.
{quote} Yes, there were low response from my point of view on 26-feb. Sell-off. But a good option could have been a short today, 12,40-60, because this gap can act as a border. Or it will be fullfilled? Looking it at now, we would be with a s/l at BE. And it can be a very good short. You can think that the big hands that sold on 26-feb are still there, and then it's going to be a border, or if they have changed, it will be fullfilled. I am thinking too much and I scalp on 15m.
Ignored
In my books 15min charts are not scalping. Very far from that
Thats really....i mean....unbelivable....its 16th century tactic. It worked then. It provoked action. It provoked it ever since Spanish empire. and they seem to be using same tactic as it works.
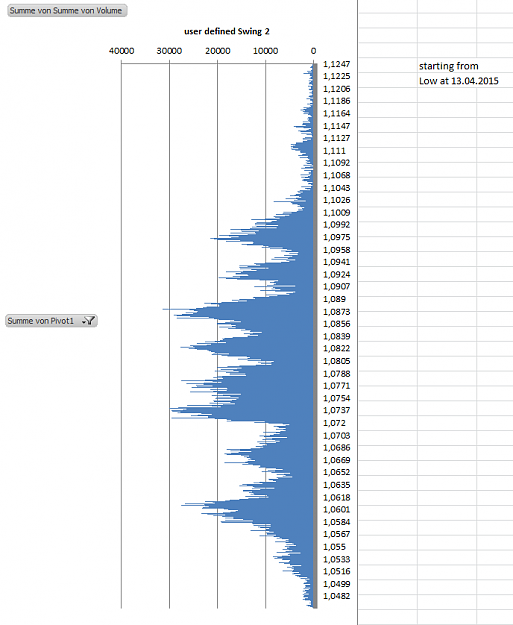
this is the distribution from the 1.04x low price is acrually of the +3 SD of this distribution {image}
Ignored
Yes, agreed. First, we are in the SD3 price area. Second, this area is the non business area.
I find myself enlighted as to when I am talking the price should work out the non-business area, I mean that I am currently working with charts at relatively low timeframes, so my point of view is rather for tactical motions.
Your point of view is strategical, that is why you are right globally - the price tends passing through the low volume areas to meet new supply/demand areas with new support/resistance prices.
{quote} To both of you while this volume analisis looks nice and works too, its no need to complicate it that much. Supply and demand picture tells exactly what volume analisis says. You dont even need volume numbers and you can plot pretty much most of those zones in few seconds on. PA tells you where important battles are taken, and also where low volume battles were taken, for low volume battle i always compare leg to leg (left to right ) to get rejections. Results are the same, but 10 times less work.http://prntscr.com/703bro...
Ignored
As to your chart,
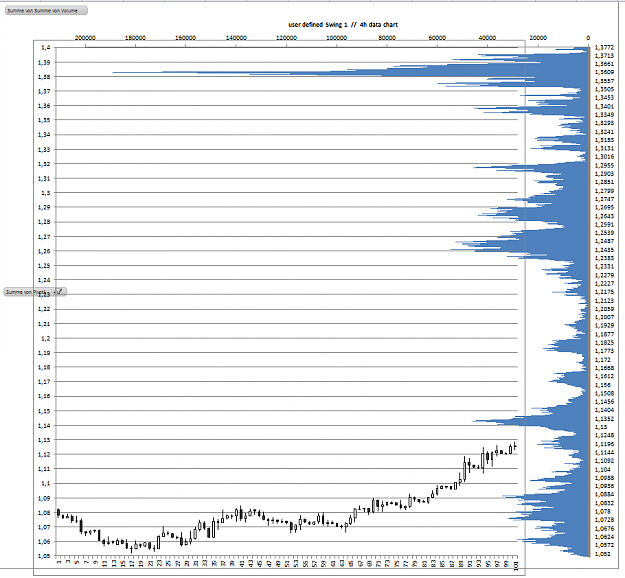
From one side we have a breackout at the 1,05 level and these prices have not been tested yet.
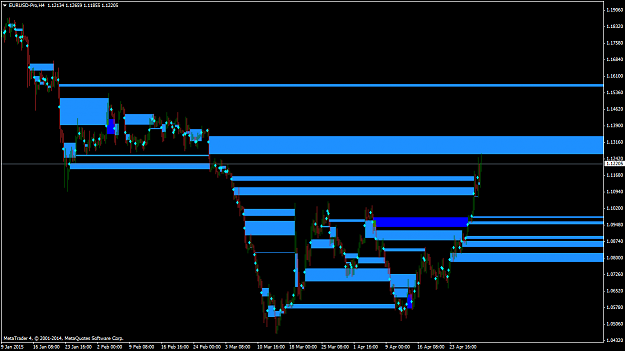
On the other hand, we have 1,125 - 1,135 hidden gap (in the resent past, the 4h chart is below).
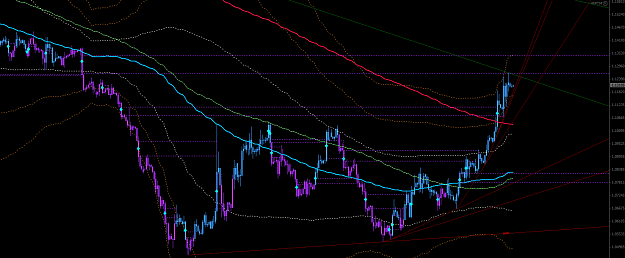
In the picture below you can find that the current prices are overbought a little and they are between the second and the third standart deviations (the first standart deviation is white dotted). Yet I prefer to think that the prices come back to the area of the first SD next week, and then go up to fulfill new price areas (of course any other analysis can bring us to the opposite conclusions ). And do not forget it is friday today that can show us some surprises, and moreover Europe is having rest.
{quote} Hmm, looking at the following chart: What I can look at, it's that when there is a big trend or momentum, the market try to fullfill the gaps that are before the reverse. Sometimes this gaps acts like a border, sometimes the gap must be fullfilled. I do not know the reason, the market acts in this way and when choose one way or the other. Is astonishingly how the markets reacts when touch this gaps or fullfilled them ( specially in hour timeframes ) I can see a gap daily/4 hour from the day 26 february, the day when
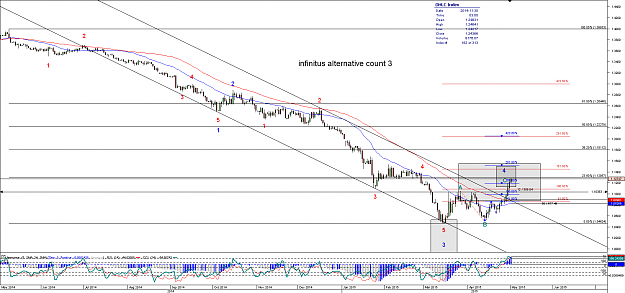
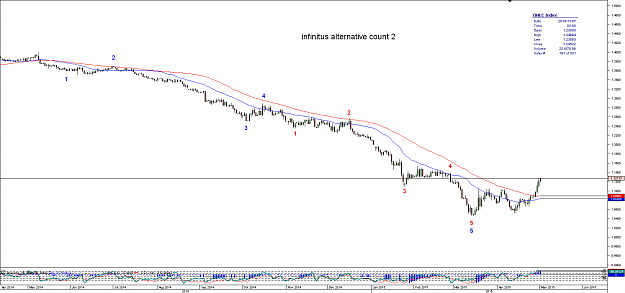
we can play this main count = alternative 3 {image} or this {image}
Ignored
let us look at the second chart (alternative 2) again, in order to be prepared if the shit hits the fan:
fib retracement levels:
23,60% @ 1296
38,20% @ 1811
50% @2228
61.80% @ 2645
Attached Image (click to enlarge)
Retail sentiment is still quiet bearish, although some broker outlets show that the short positioning decreased a bit over the last days.
Some broker also show, that retails have a lot of pending buy orders in the area between 12x and 10x
So the picture here is a bit mixed. The pending buy orders may be in fact orders to cover their bleeding short positions.
From a sentiment view, retail trader have not lost hope on their short positions to eventually BE or so.
That in return may mean, that we might see further gains in the days ahead, until the retail crowd has given up (with a loss) and are starting to go long.
Looking at the chart above, the recent swing high looks damn bullish, doesn't it?
Will be very interesting to see, what they are doing with the high volume barrier in front of us (which POC is around 1340.
Since we will face a few days with more or less low liquidity, it reminds me on the days around last Christmas, where they managed to pierce through old ultra high volume zones effortlessly
{quote} let us look at the second chart (alternative 2) again, in order to be prepared if the shit hits the fan: fib retracement levels: 23,60% @ 1296 38,20% @ 1811 50% @2228 61.80% @ 2645 {image} Retail sentiment is still quiet bearish, although some broker outlets show that the short positioning decreased a bit over the last days. Some broker also show, that retails have a lot of pending buy orders in the area between 12x and 10x So the picture here is a bit mixed. The pending buy orders may be in fact orders to cover their bleeding short positions....