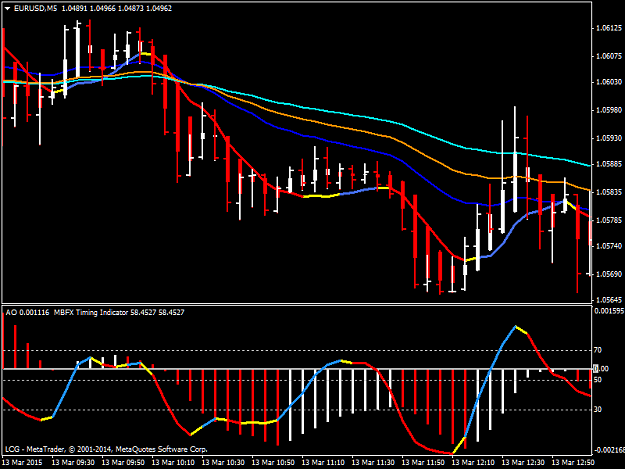
Time based charts are an option. There is no best one to trade as they all tell you the same information, some are just on a different granularity. The question of which to use depends on what kind of set-ups and R/R you are using - and where the opportunity exists. Whichever chart is showing you a "flat horizontal line" will be looking for a breakout. Which ever chart shows you a big move up/down will be looking to correct or to consolidate and breakout again.
Some traders trade off of a DOM only, and simply use the tape. Some use time based charts - while others will use price based charts like P/F, range or renko.
Some traders trade off of a DOM only, and simply use the tape. Some use time based charts - while others will use price based charts like P/F, range or renko.

