• Home
  • Forums
  • Trades
  • News
  • Calendar
  • Market
  • Brokers
  • Login
  • Join
  • User/Email: Password:
  • 12:34am
Menu
  • Forums
  • Trades
  • News
  • Calendar
  • Market
  • Brokers
  • Login
  • Join
  • 12:34am
Sister Sites
  • Metals Mine
  • Energy EXCH
  • Crypto Craft

Options

Bookmark Thread

First Page First Unread Last Page Last Post

Print Thread

Similar Threads

Help Me Establish The GbpUsd After Dinner Club 40 replies

  • Interactive Trading
  • /
  • Reply to Thread
  • Subscribe
  • 6,685
Attachments: The Club!
Exit Attachments

The Club!

  • Last Post
  •  
  • 1 926927Page 928929930 1214
  • 1 Page 928 1214
  •  
  • Post #18,541
  • Quote
  • Apr 7, 2015 9:55am Apr 7, 2015 9:55am
  •  Mad Russian
  • | Joined Jun 2012 | Status: Member | 1,135 Posts
Quoting Dr.Phoenix
Disliked
It is so obviously, why do not Ukranian people see the obvious? As last I see somebody is writing about the obvious. Caution ! it is one personal opinion. Why IMF, Soros, West Doesnt Care if Ukraine Pays Back Loans http://www.thicktoast.com/ukraine-loans/ Best, D.P.
Ignored
Plus land full of Chernozem!!!
 
 
  • Post #18,542
  • Quote
  • Apr 7, 2015 12:12pm Apr 7, 2015 12:12pm
  •  janpec1000
  • Joined Nov 2012 | Status: Member | 12,211 Posts
Quoting Mad Russian
Disliked
{quote} Plus land full of Chernozem!!!
Ignored
Tinted with Chernobil. But still fertile.
 
 
  • Post #18,543
  • Quote
  • Apr 7, 2015 1:43pm Apr 7, 2015 1:43pm
  •  janpec1000
  • Joined Nov 2012 | Status: Member | 12,211 Posts
Quoting janpec1000
Disliked
{quote} Tinted with Chernobil. But still fertile.
Ignored
Speaking about Chernobyl:
http://www.zerohedge.com/news/2015-0...lear-submarine
 
 
  • Post #18,544
  • Quote
  • Apr 7, 2015 1:56pm Apr 7, 2015 1:56pm
  •  Dr.Phoenix
  • Joined Mar 2012 | Status: turning probability into profit | 1,550 Posts
Quoting janpec1000
Disliked
{quote} Speaking about Chernobyl: http://www.zerohedge.com/news/2015-0...lear-submarine
Ignored
The APS will be flooded in order to put down the fire - the decision is already taken into fulfilling.

D.P.
Hunting High and Low
 
 
  • Post #18,545
  • Quote
  • Apr 7, 2015 3:04pm Apr 7, 2015 3:04pm
  •  infinitus
  • Joined Jun 2010 | Status: s = k log W | 20,603 Posts
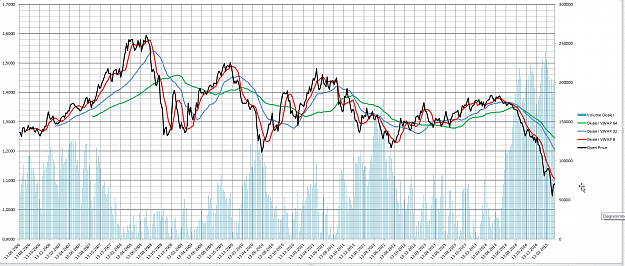
Hey friends,

nice readings you provided


EU

Analysis of TIFF COT Data

In this report structure is more detailing:

Swap Dealers (the Comms)

Leveraged Money (basically the large speculators) (this is the big fish inside the large speculators)

Asset Manager (large speculators)

Other Reporting (large speculators)

Non Reporting (small speculators)


I have analysed the traded money of the Swap dealers in order to find "fair Value" of EURUSD


I analysed via floating VWAP with look-back periods of 8, 32 and 64 weeks

Here is the result:

VWAP 8: 1.1051

VWAP 32: 1.2041

VWAP 64: 1.2450


The 1051 was already tested 2 days ago. Above 1051 would be bullish
Attached Image (click to enlarge)
Click to Enlarge

Name: mm.png
Size: 199 KB
 
 
  • Post #18,546
  • Quote
  • Apr 7, 2015 3:15pm Apr 7, 2015 3:15pm
  •  Dr.Phoenix
  • Joined Mar 2012 | Status: turning probability into profit | 1,550 Posts
Quoting infinitus
Disliked
Hey friends, nice readings you provided EU Analysis of TIFF COT Data In this report structure is more detailing: Swap Dealers (the Comms) Leveraged Money (basically the large speculators) (this is the big fish inside the large speculators) Asset Manager (large speculators) Other Reporting (large speculators) Non Reporting (small speculators) I have analysed the traded money of the Swap dealers in order to find "fair Value" of EURUSD I analysed via floating VWAP with look-back periods of 8, 32 and 64 weeks Here is the result: VWAP 8: 1.1051...
Ignored
Woow! So, do you have the next volume motivated price areas of the big players, which are confirmed by the sentiments of theirs?
Do I rightly understand?

Best,
D.P.
Hunting High and Low
 
 
  • Post #18,547
  • Quote
  • Apr 7, 2015 3:19pm Apr 7, 2015 3:19pm
  •  infinitus
  • Joined Jun 2010 | Status: s = k log W | 20,603 Posts
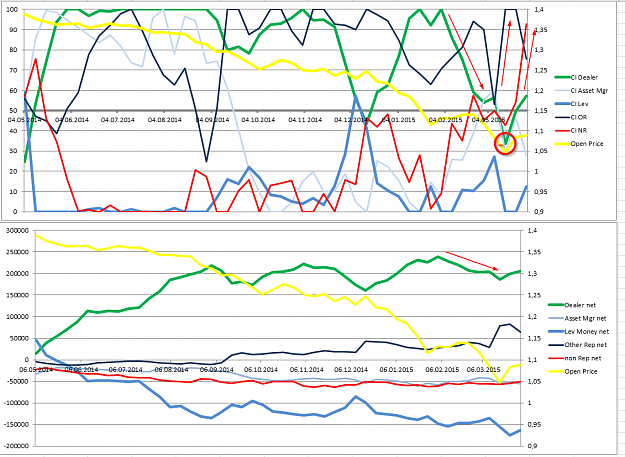
EU TIFF COT

I calculated also the COT index with a lookback period of 26 weeks for the participants.

It was interesting to see, how the COT Index for the Swap dealers collapsed from 100 to around 30 before the yearly low. The had used the consolidating phase in February to reduce their long holdings a bit.

First Chart is the COT Index

Second chart are the net-positions of the participants


Also notice, how the small Specs (red curves) reduced their short positions the last few weeks, which resulted in their COT Index to soar from nearly 0 to now above 90. That may be a good sign, that the recent rally we saw is only short lived
Attached Image (click to enlarge)
Click to Enlarge

Name: mm.png
Size: 116 KB
 
 
  • Post #18,548
  • Quote
  • Apr 7, 2015 3:28pm Apr 7, 2015 3:28pm
  •  infinitus
  • Joined Jun 2010 | Status: s = k log W | 20,603 Posts
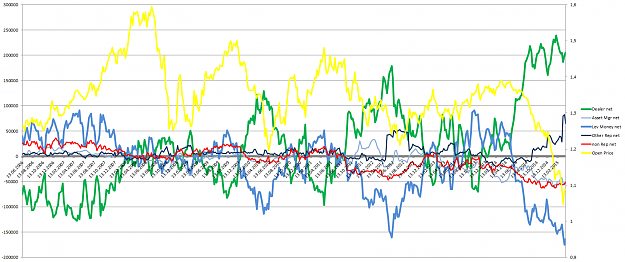
EU

TIFF COT

Net Positions of the participants from 2006
Attached Image (click to enlarge)
Click to Enlarge

Name: mm.png
Size: 187 KB
 
 
  • Post #18,549
  • Quote
  • Apr 7, 2015 3:50pm Apr 7, 2015 3:50pm
  •  infinitus
  • Joined Jun 2010 | Status: s = k log W | 20,603 Posts
Quoting Dr.Phoenix
Disliked
{quote} Woow! So, do you have the next volume motivated price areas of the big players, which are confirmed by the sentiments of theirs? Do I rightly understand? Best, D.P.
Ignored


Hi DP,

price shows a high tendency to return to the floating VWAP 32 and 64. They act as kind of S/R

Question is: how long will price be able to drag the VWAP's further down?

Every time the spread between the VWAP's get really high (we have around 1000pips between the the VWAP 8 and VWAP 32 now), chance for mean reverting goes up.

The Swap Dealers (or Commercials) do mainly hedging. Out of logical considerations they should be interested that price may reverse to the mean, at least.

Since the Dealers were net long since the 399x high, that are around 50 weeks, the truth of the value area may between the VWAP 32 and 64 (so between 1.20 and 1.245)
 
 
  • Post #18,550
  • Quote
  • Apr 7, 2015 3:51pm Apr 7, 2015 3:51pm
  •  infinitus
  • Joined Jun 2010 | Status: s = k log W | 20,603 Posts
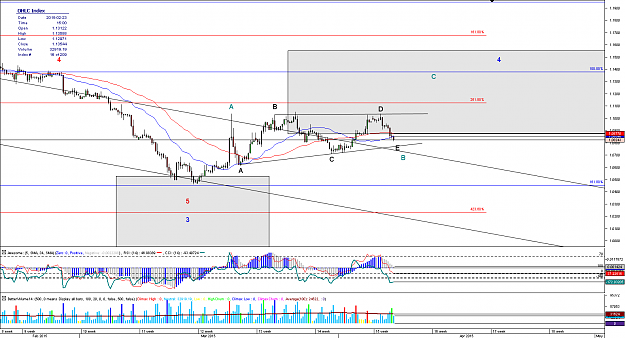
EU

EW proposal

4h TF

Triangle scenario
Attached Image (click to enlarge)
Click to Enlarge

Name: Chart_EUR_USD_4 Hours_snapshot.png
Size: 48 KB
 
 
  • Post #18,551
  • Quote
  • Apr 7, 2015 3:57pm Apr 7, 2015 3:57pm
  •  infinitus
  • Joined Jun 2010 | Status: s = k log W | 20,603 Posts
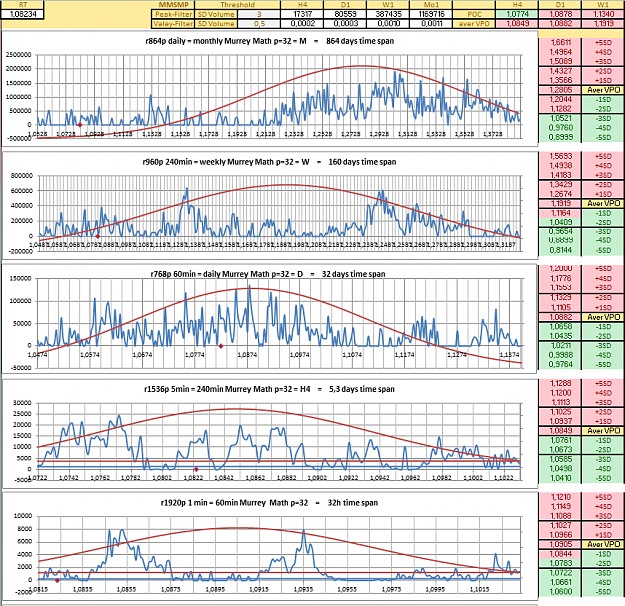
EU Volume profiles
Attached Image (click to enlarge)
Click to Enlarge

Name: mm.png
Size: 135 KB
 
 
  • Post #18,552
  • Quote
  • Apr 7, 2015 6:32pm Apr 7, 2015 6:32pm
  •  infinitus
  • Joined Jun 2010 | Status: s = k log W | 20,603 Posts
http://www.zerohedge.com/sites/defau.../picture-5.jpg
Why ECB's March Purchase Of €11 Billion In German Treasurys Will Be A Problem
 
 
  • Post #18,553
  • Quote
  • Apr 8, 2015 2:29am Apr 8, 2015 2:29am
  •  Dr.Phoenix
  • Joined Mar 2012 | Status: turning probability into profit | 1,550 Posts
Hi, Markus

Quoting infinitus
Disliked
{quote}Price shows a high tendency to return to the floating VWAP 32 and 64. They act as kind of S/R
Ignored
and

Quoting infinitus
Disliked
{quote}Out of logical considerations they should be interested that price may reverse to the mean, at least.
Ignored
These theses are all known for both of us. Do not forget? the difference is that we are at the different TFs. However...

Quoting infinitus
Disliked
{quote} Question is: how long will price be able to drag the VWAP's further down? Every time the spread between the VWAP's get really high (we have around 1000pips between the the VWAP 8 and VWAP 32 now), chance for mean reverting goes up. The Swap Dealers (or Commercials) do mainly hedging. Since the Dealers were net long since the 399x high, that are around 50 weeks, the truth of the value area may between the VWAP 32 and 64 (so between 1.20 and 1.245)
Ignored
Concerning the above said thing, I thought that those sentiment charts could be described by VWAPs. I think, we can try this technique and to see what it does to us.

The matter is that the sentiments are linked to the volumes directly. So if we have charts with sentiments-like "candles" (I mean the santiments splitted into time intervals), we can use (merge) both VWAP lines and santiments "candle"-intervals at the same chart.

How do you think?

Best,
D.P.
Hunting High and Low
 
 
  • Post #18,554
  • Quote
  • Apr 8, 2015 2:48am Apr 8, 2015 2:48am
  •  Dr.Phoenix
  • Joined Mar 2012 | Status: turning probability into profit | 1,550 Posts
There is something historical for you to think of.

The Truth about the Conflict with Russia

https://biblicisminstitute.wordpress...t-with-russia/

Best,
D.P.
Hunting High and Low
 
 
  • Post #18,555
  • Quote
  • Apr 8, 2015 6:15am Apr 8, 2015 6:15am
  •  infinitus
  • Joined Jun 2010 | Status: s = k log W | 20,603 Posts
Quoting Dr.Phoenix
Disliked
Hi, Markus {quote} and {quote} These theses are all known for both of us. Do not forget? the difference is that we are at the different TFs. However... {quote} Concerning the above said thing, I thought that those sentiment charts could be described by VWAPs. I think, we can try this technique and to see what it does to us. The matter is that the sentiments are linked to the volumes directly. So if we have charts with sentiments-like "candles" (I mean the santiments splitted into time intervals), we can use (merge) both VWAP lines and santiments...
Ignored

What do you mean exactly by sentiment?

The volume traded by the Swap Dealers?

If so, you mean we should make a volume profile of the volume/price of Swap dealers?
 
 
  • Post #18,556
  • Quote
  • Apr 8, 2015 6:18am Apr 8, 2015 6:18am
  •  infinitus
  • Joined Jun 2010 | Status: s = k log W | 20,603 Posts
Quoting infinitus
Disliked
{quote} What do you mean exactly by sentiment? The volume traded by the Swap Dealers? If so, you mean we should make a volume profile of the volume/price of Swap dealers?
Ignored

If so, keep in mind:

the COT data is only published once a week.

So we have to attribute the volume of a whole week into a weekly candle. So if we are unlucky, the candle will spread several hundreds of pips, where we do not know, where the Dealers bought what amount.

I think this way will lead to nothing......
 
 
  • Post #18,557
  • Quote
  • Apr 8, 2015 7:39am Apr 8, 2015 7:39am
  •  Dr.Phoenix
  • Joined Mar 2012 | Status: turning probability into profit | 1,550 Posts
Quoting infinitus
Disliked
{quote}the COT data is only published once a week. So we have to attribute the volume of a whole week into a weekly candle
Ignored
Arrhh, what a pity! So we can not split all the data into days, for example.

Best,
D.P.
Hunting High and Low
 
 
  • Post #18,558
  • Quote
  • Apr 8, 2015 9:14am Apr 8, 2015 9:14am
  •  Forexcube
  • Joined Nov 2009 | Status: Member | 27,245 Posts
I compare Sentiments in other markets, sometimes.
e.g.
Treasury Bond Futures Put/Call Ratio
CBOE put/call volume ratio (and the VXO, so also VIX)
Treasury Bond, COT Data,
Treasury Bond Primary Dealer Positions &
T-Bill Rate Expectations by Money Fund Managers.
and AAII (www.aaii.com)
FXcube
 
 
  • Post #18,559
  • Quote
  • Apr 8, 2015 10:29am Apr 8, 2015 10:29am
  •  infinitus
  • Joined Jun 2010 | Status: s = k log W | 20,603 Posts
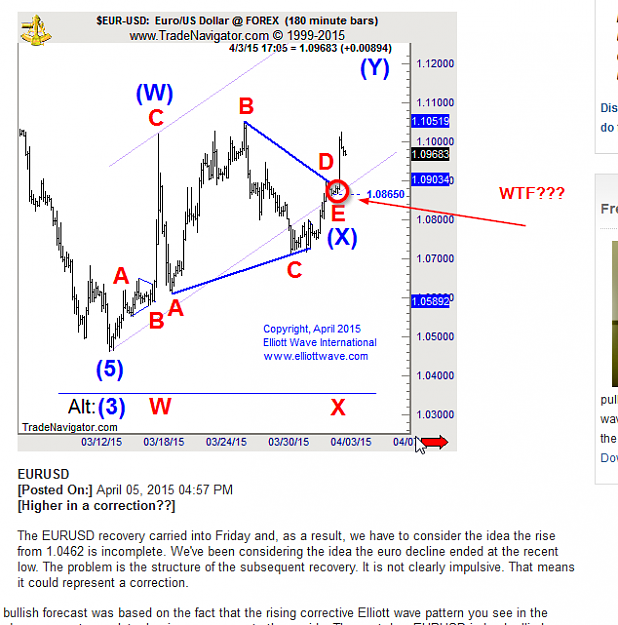
this is a "Masterpiece" of EWI

They have published it via Twitter which linked to

http://www.elliottwave.com/freeupdat...OT-Random.aspx


Look at the E wave they have labelled!!!

When doing so, one can nearly every time label impulses, triangles, unicorns.....
Attached Image (click to enlarge)
Click to Enlarge

Name: mm.png
Size: 40 KB
 
 
  • Post #18,560
  • Quote
  • Edited at 11:06am Apr 8, 2015 10:50am | Edited at 11:06am
  •  infinitus
  • Joined Jun 2010 | Status: s = k log W | 20,603 Posts
If you like to use COT Data on MT4, try the following files:

I have completed the COT Hist data until last issue in April 2015


so you can work with it without downloading additional data. Friday you then have to download the fresh updated file for 2015


All explanations are in the readme files


The authors of these indies etc. have done an outstanding work

Special thanks to http://www.forexfactory.com/fxdaytrader_

and Vasily Sokolov


EDIT: can not load the history data on FF server - do not know why. It keeps on loading or security scanning


when I fail loading the history data, then take it out of the download provided on this page:

http://www.pipsologie.com/cot-report...r-metatrader-4


but do not use the MT4 files - they may not be functioning on the new builds


Use the MT4 files in my posting
Attached File
File Type: zip mt4.COT.10.03.2014_1.build600.zip   357 KB | 229 downloads
 
 
  • Interactive Trading
  • /
  • The Club!
  • Reply to Thread
    • 1 926927Page 928929930 1214
    • 1 Page 928 1214
0 traders viewing now
  • More
Top of Page
  • Facebook
  • Twitter
About FF
  • Mission
  • Products
  • User Guide
  • Media Kit
  • Blog
  • Contact
FF Products
  • Forums
  • Trades
  • Calendar
  • News
  • Market
  • Brokers
  • Trade Explorer
FF Website
  • Homepage
  • Search
  • Members
  • Report a Bug
Follow FF
  • Facebook
  • Twitter

FF Sister Sites:

  • Metals Mine
  • Energy EXCH
  • Crypto Craft

Forex Factory® is a brand of Fair Economy, Inc.

Terms of Service / ©2022