Disliked{quote} If you look carefully to the chart price trades very close to the middle channel. This is very important information to decide the trade. Sai RamIgnored
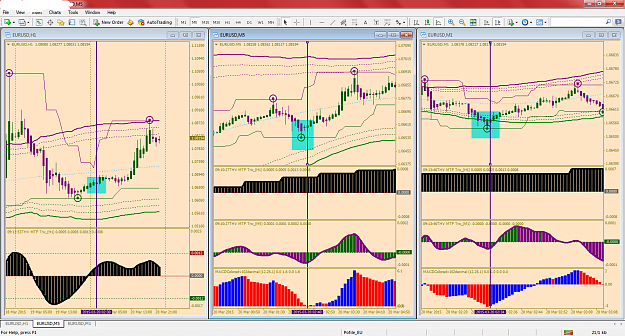
e.g. if main (higher timeframe) trend is up it`s hard to find on lower timeframe where price hit lower renkostreet channel, plus lower TMA channel.
For examplePost 724
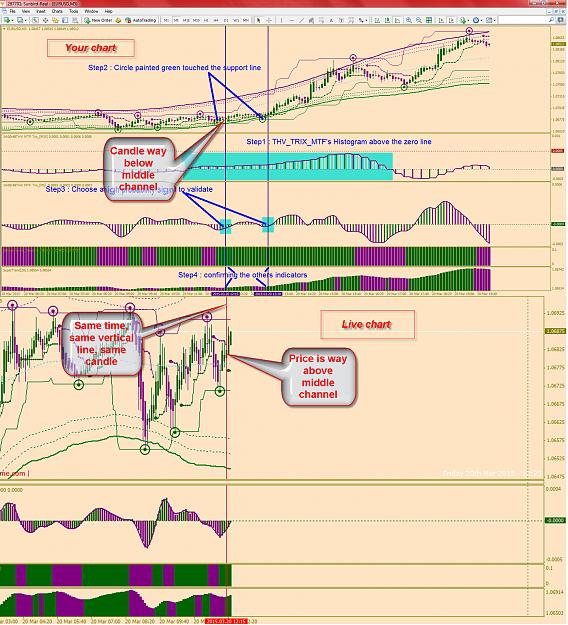
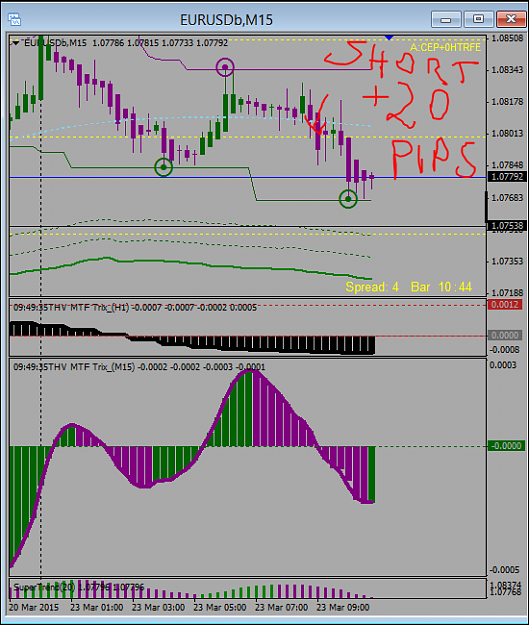
Your chart is showing that at entry point price and candle is way down at lower tma channel and entry is fine considering requirements. But it is a historical chart and as we know tma repaints (it is turning uphill later on on your chart, that is why candle is at lower channel at entry).
I wasn`t too lazy to backtest it, and this how it looked like during live trading conditions.
Do you find such a perfect entry (like it should be on your picture) during live market conditions?
Thanks in advance.
Attached Image (click to enlarge)