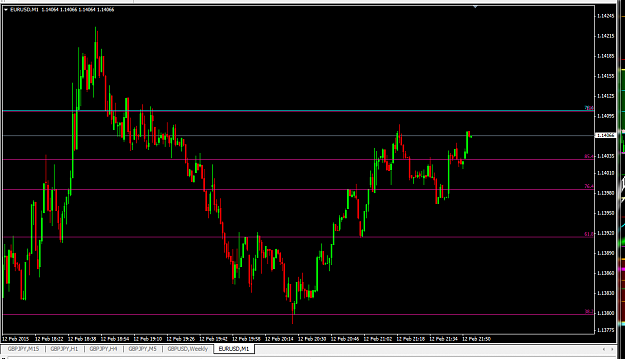
DislikedUpdate on the 1Minute Chart (I'm using 1Minute so you can see that all the bounces today have occurred at 85.4/14.6 and 38.2/68.1 From this chart after hitting the 1.14097 Fib this morning it retraced exactly down to the 61.8 and rebounded. This is for the EURUSD. {image}Ignored
Hi GN,
Thanks for showing your way of using/drawing fib lines. Helps me a lot.
I have been drawing fib lines on the EU chart from the initial value you mention in post 1.
Interesting to see how price behaves at those levels.
Still have a few questions if you don't mind.
When you draw a fib level in a fib level, you always draw the lower fib levels between two higher fib levels? Draw new serie of lower fib levels between i.e. a 38.2 and an 61.8 level, is that the correct way?
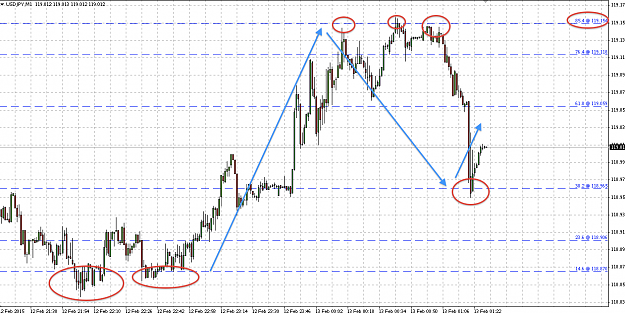
Just noticed in this last EU chart you draw the fib levels the other way, any reason for that?
Wondering if price will bounce at that 85.4 level. (also happens to be my H5 Camarilla pivot level of today........)
Attached Image (click to enlarge)