• Home
  • Forums
  • Trades
  • News
  • Calendar
  • Market
  • Brokers
  • Login
  • Join
  • User/Email: Password:
  • 11:34am
Menu
  • Forums
  • Trades
  • News
  • Calendar
  • Market
  • Brokers
  • Login
  • Join
  • 11:34am
Sister Sites
  • Metals Mine
  • Energy EXCH
  • Crypto Craft

Options

Bookmark Thread

First Page First Unread Last Page Last Post

Print Thread

Similar Threads

Price movement as a function of Supply and Demand 43 replies

Supply and demand zones and EW principles 1 reply

How Markets Work, in a Nutshell! 32 replies

Supply and Demand Zones 43 replies

Demand and Supply 1 reply

  • Commercial Content
  • /
  • Reply to Thread
  • Subscribe
  • 5,247
Attachments: Supply and demand in a nutshell by Alfonso Moreno
Exit Attachments

Supply and demand in a nutshell by Alfonso Moreno

  • Last Post
  •  
  • 1 265266Page 267268269 486
  • 1 Page 267 486
  •  
  • Post #5,321
  • Quote
  • Feb 12, 2015 1:57am Feb 12, 2015 1:57am
  •  panoramia
  • | Commercial Member | Joined Aug 2011 | 3,525 Posts
Quoting SDaytrader
Disliked
Hello, I am interested in this strategy. I would like to play on the small tf. Day trading or scalping. Is anyone here playing TF m1 and m5? Is this strategy is suitable for day trading / scalping?
Ignored
It's suitable for any timeframe, but you must be aware that the lower the timeframe the more levels and the more noise you will see, so you must be really really good at detecting imbalances, choose the right timeframes for your sequence, and test them it thoroughly for quite some time.

Cheers,
Alfonso
Set and Forget supply and demand trading community
 
 
  • Post #5,322
  • Quote
  • Feb 12, 2015 2:12am Feb 12, 2015 2:12am
  •  rickyfx
  • | Commercial Member | Joined Sep 2011 | 54 Posts
GBPAUD
Monthly,weekly, daily all are in Up trend but price now reached a fresh H4 area or supply which is nested within fresh daily area of supply and monthly supply zone proximal line. The fresh monthly zone is almost 1000 pips in size. So what should we do in this situation for swing type of trading ? supposing we dont have counter trading in our trading rules. Only sell in this big fat monthly supply area ? @Alfonso


Monthly UP
http://s24.postimg.org/4ypf1m351/screenshot_494.png


Weekly Up
http://s24.postimg.org/ff5j3y25h/screenshot_495.png

Daily Up

http://s24.postimg.org/u0wjs6yxx/screenshot_496.png

Daily level that taking control
http://s24.postimg.org/qdldzvg4l/screenshot_497.png


H4 Up
http://s24.postimg.org/tkkix8pyd/screenshot_499.png
 
 
  • Post #5,323
  • Quote
  • Feb 12, 2015 2:34am Feb 12, 2015 2:34am
  •  SDaytrader
  • | Commercial Member | Joined Feb 2015 | 20 Posts
Quoting panoramia
Disliked
{quote} It's suitable for any timeframe, but you must be aware that the lower the timeframe the more levels and the more noise you will see, so you must be really really good at detecting imbalances, choose the right timeframes for your sequence, and test them it thoroughly for quite some time. Cheers, Alfonso
Ignored
Ok.

First I have to learn how to set these zones at higher tf, then smaller.
If you interested my strategy, send to me private message.
 
 
  • Post #5,324
  • Quote
  • Feb 12, 2015 2:44am Feb 12, 2015 2:44am
  •  shatz
  • | Joined Oct 2013 | Status: Member | 20 Posts
Quoting Psych0F0x
Disliked
{quote} SO MANY PROPS! Thank you so much for sharing that! As a fellow gamer I love having the keys be near.
Ignored
Hi Psych,

Please PM me your email so I can send you.

Br
 
 
  • Post #5,325
  • Quote
  • Feb 12, 2015 3:50am Feb 12, 2015 3:50am
  •  SDaytrader
  • | Commercial Member | Joined Feb 2015 | 20 Posts
Renko chart - zones are more readable and easier to draw.
If you interested my strategy, send to me private message.
 
 
  • Post #5,326
  • Quote
  • Feb 12, 2015 4:23am Feb 12, 2015 4:23am
  •  panoramia
  • | Commercial Member | Joined Aug 2011 | 3,525 Posts
Quoting SDaytrader
Disliked
Renko chart - zones are more readable and easier to draw.
Ignored
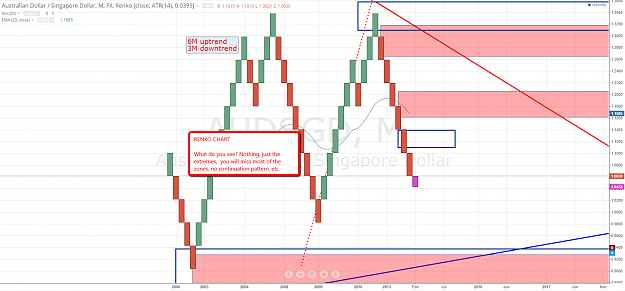
I must disagree with you, Renko charts will not allow you to draw all zones, you will miss MANY, probably the most important ones. You say they are more readable but as you can see there are hardly zones that can be detected on Renko charts

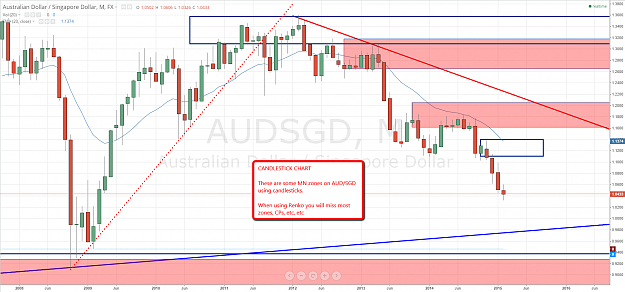
Let me show you an example with AUD/SGD

These are some MN zones on AUD/SGD using candlesticks. When using Renko you will miss most zones, CPs, etc, etc. A similar happens with Heiken Ashi charts

AUD/SGD Candlesticks Monthly Chart
See how many zones there are? Some are not painted, it shows 3 months zones as well

Attached Image (click to enlarge)
Click to Enlarge

Name: Screenshot1.png
Size: 139 KB


AUD/SGD Renko Monthly Chart

What do you see? Nothing, just the extremes, you will miss most of the zones, no continuation pattern, etc

Attached Image (click to enlarge)
Click to Enlarge

Name: Screenshot2.png
Size: 123 KB
Set and Forget supply and demand trading community
 
 
  • Post #5,327
  • Quote
  • Feb 12, 2015 4:27am Feb 12, 2015 4:27am
  •  panoramia
  • | Commercial Member | Joined Aug 2011 | 3,525 Posts
Quoting rickyfx
Disliked
GBPAUD Monthly,weekly, daily all are in Up trend but price now reached a fresh H4 area or supply which is nested within fresh daily area of supply and monthly supply zone proximal line. The fresh monthly zone is almost 1000 pips in size. So what should we do in this situation for swing type of trading ? supposing we dont have counter trading in our trading rules. Only sell in this big fat monthly supply area ? @Alfonso Monthly UP {image} Weekly Up {image} Daily Up {image} Daily level that taking control {image} H4 Up {image}
Ignored
There is no reason to sell on GBP/CAD just because it's monthly supply. That means we are high in the curve, but why selling when we've got a bigger picture uptrend. For selling we need quite a few things happenning, don't try to outsmart the markets being the first one shorting trying to get a reversal, you will soon see your account blown up.

Cheers,
Alfonso
Set and Forget supply and demand trading community
 
 
  • Post #5,328
  • Quote
  • Feb 12, 2015 4:56am Feb 12, 2015 4:56am
  •  ahmedalhosenyy
  • | Joined Oct 2006 | Status: Member | 57 Posts
Quoting panoramia
Disliked
{quote} I didn't understand your question on GBP/USD D1 timeframe, sorry. Can you please explain it a bit clearer? D1 is trying to realign with 3 months uptrend Cheers, Alfonso
Ignored
yes daily try to realign with 3 months But it is against weekly and monthly !!!! this make me confused


IF daily aligned with 3 months so logically go with the 3 months direction but what about the opposed signals of weekly and monthly !!!!!!
 
 
  • Post #5,329
  • Quote
  • Feb 12, 2015 4:56am Feb 12, 2015 4:56am
  •  SDaytrader
  • | Commercial Member | Joined Feb 2015 | 20 Posts
Renko chart - 5 points x 2

easier
Attached Image (click to enlarge)
Click to Enlarge

Name: [DAX30]M5.png
Size: 48 KB
If you interested my strategy, send to me private message.
 
 
  • Post #5,330
  • Quote
  • Feb 12, 2015 5:06am Feb 12, 2015 5:06am
  •  SDaytrader
  • | Commercial Member | Joined Feb 2015 | 20 Posts
Quoting panoramia
Disliked
{quote} I must disagree with you, Renko charts will not allow you to draw all zones, you will miss MANY, probably the most important ones. You say they are more readable but as you can see there are hardly zones that can be detected on Renko charts Let me show you an example with AUD/SGD These are some MN zones on AUD/SGD using candlesticks. When using Renko you will miss most zones, CPs, etc, etc. A similar happens with Heiken Ashi charts AUD/SGD Candlesticks Monthly Chart See how many zones there are? Some are not painted, it shows 3 months zones...
Ignored
I agree but you can use a variety of "tf".

You can use 5 points / 10/15/20 etc. In this way, showing different zones depending on the range.

I spent a lot of time with renko, I will try to show.

Cp patern can be seen at point x1 retreat.
If you interested my strategy, send to me private message.
 
 
  • Post #5,331
  • Quote
  • Feb 12, 2015 5:35am Feb 12, 2015 5:35am
  •  raselnet
  • | Membership Revoked | Joined Jan 2015 | 213 Posts
hello,
i have go through your full content and understood its very good strategy can i know which time fame will i start to use it.


------------------SIGNATURE-----------------------
Download over 2900 forex robots and indicators for 100% FREE at: http://mt4talk.com/
 
 
  • Post #5,332
  • Quote
  • Feb 12, 2015 5:48am Feb 12, 2015 5:48am
  •  panoramia
  • | Commercial Member | Joined Aug 2011 | 3,525 Posts
Quoting SDaytrader
Disliked
Renko chart - 5 points x 2 easier {image}
Ignored
One thing, charts lower than H4 timeframe are not allowed in this thread. Why? it is a swing/position thread, looking at M5, M15 and lower timeframes is forbidden when you are trading the bigger picture, you don't care about those. Could you please can remove previous post?

Thanks,
Alfonso
Set and Forget supply and demand trading community
 
 
  • Post #5,333
  • Quote
  • Feb 12, 2015 5:49am Feb 12, 2015 5:49am
  •  panoramia
  • | Commercial Member | Joined Aug 2011 | 3,525 Posts
Quoting raselnet
Disliked
hello, i have go through your full content and understood its very good strategy can i know which time fame will i start to use it. ------------------SIGNATURE----------------------- Download over 2900 forex robots and indicators for 100% FREE at: http://mt4talk.com/
Ignored
H4, D1 timeframes are used for entries. This is a swing/position thread, using lower timeframes go against the rules.

Cheers,
Alfonso
Set and Forget supply and demand trading community
 
 
  • Post #5,334
  • Quote
  • Feb 12, 2015 7:03am Feb 12, 2015 7:03am
  •  rickyfx
  • | Commercial Member | Joined Sep 2011 | 54 Posts
Quoting panoramia
Disliked
{quote} There is no reason to sell on GBP/CAD just because it's monthly supply. That means we are high in the curve, but why selling when we've got a bigger picture uptrend. For selling we need quite a few things happenning, don't try to outsmart the markets being the first one shorting trying to get a reversal, you will soon see your account blown up. Cheers, Alfonso
Ignored

Thank you for the reply. This is the most confusing part for me, what to do when HTF like MN/WK fresh area been hit. trying to understand this.
 
 
  • Post #5,335
  • Quote
  • Edited at 10:17am Feb 12, 2015 9:59am | Edited at 10:17am
  •  panoramia
  • | Commercial Member | Joined Aug 2011 | 3,525 Posts
Quoting rickyfx
Disliked
{quote} Thank you for the reply. This is the most confusing part for me, what to do when HTF like MN/WK fresh area been hit. trying to understand this.
Ignored
See the bigger timeframes supply and demand zones (the ones we use for the curve) as a traffic light. Imagine you are driving along a 3 lanes highway at 120 km per hour and suddenly the 3 lanes become just one because there is a nearby crossroad, there is a traffic light and it turns red.

The questions you must ask yourself are these:

  1. Will you drive through that cross road at full speed without paying attention to the red traffic light?
  2. Does having the traffic light in red means that you have to turn 180 and drive back home? No, it doesn't. It just means that you must stop your car, look left and right, wait for the traffic light to turn green, look left and right again and resume driving in the same direction.

You should see bigger timeframes of supply and demand curve timeframes as that

Makes sense?
Alfonso

Set and Forget supply and demand trading community
 
 
  • Post #5,336
  • Quote
  • Feb 12, 2015 1:29pm Feb 12, 2015 1:29pm
  •  raselnet
  • | Membership Revoked | Joined Jan 2015 | 213 Posts
Quoting panoramia
Disliked
{quote} H4, D1 timeframes are used for entries. This is a swing/position thread, using lower timeframes go against the rules. Cheers, Alfonso
Ignored
thanks for the information can you tell me whichi platform it works better and which broker...


------------------SIGNATURE-----------------------
Download over 2900 forex robots and indicators for 100% FREE at: http://mt4talk.com/
 
 
  • Post #5,337
  • Quote
  • Feb 13, 2015 2:26am Feb 13, 2015 2:26am
  •  panoramia
  • | Commercial Member | Joined Aug 2011 | 3,525 Posts
Quoting Fatyflathead
Disliked
Hi Alfonso, I need to put up a few charts to improve my learning, I traded a live account before and blew it up through mismanagement and Laziness I have read up as far as page 220 (im catching up ) and I must say ive learned as much from reading the forum thread as I have from the videos , im using forextester 2 and maybe starting to improve , I feel I am asking myself the right questions lately when I practice and I didn't do that before. By the way anybody who thinks they don't need to foreward test is Wrong , just read the Talent...
Ignored
A quick thing my friend, H1 charts are not allowed in the thread, this is a swing/position thread, H1 has nothing to do in any longer term timeframe sequence. Would you be so kind as to remove that chart?

Thanks,
Alfonso
Set and Forget supply and demand trading community
 
 
  • Post #5,338
  • Quote
  • Feb 13, 2015 3:30am Feb 13, 2015 3:30am
  •  rickyfx
  • | Commercial Member | Joined Sep 2011 | 54 Posts
CADJPY Swing type

Weekly down took out 2 level of demand

http://s24.postimg.org/hitew2qn9/screenshot_503.png

Daily Up, aggressive trendline broken and took out 2 CP supply.

http://s24.postimg.org/5uzd1j1id/screenshot_504.png


H4 Consolidation
http://s24.postimg.org/mws73mgdh/screenshot_505.png


So Weekly is our bigger picture which is still in down trend and daily, H4 out of alignment. now we can realign with the down trend from H4 fresh level of supply which is nested within Daily supply which is nested within weekly valid Supply level.

@alfonso is it ok ?
 
 
  • Post #5,339
  • Quote
  • Feb 13, 2015 3:51am Feb 13, 2015 3:51am
  •  Fatyflathead
  • | Joined Nov 2013 | Status: Member | 14 Posts
Quoting panoramia
Disliked
{quote} A quick thing my friend, H1 charts are not allowed in the thread, this is a swing/position thread, H1 has nothing to do in any longer term timeframe sequence. Would you be so kind as to remove that chart? Thanks, Alfonso
Ignored
No Problem Alfonso , I will upload in 4Hr only.
 
 
  • Post #5,340
  • Quote
  • Feb 13, 2015 11:46am Feb 13, 2015 11:46am
  •  rickyfx
  • | Commercial Member | Joined Sep 2011 | 54 Posts
What is the trend of EURAUD monthly chart ?
at first look it seems consolidation as trendline broken and price took 1 demand level but we dont have 2 peaks so we can not draw a descending trendline.
After break of the trendline price make 2 CP pattern and took 1 demand level which validate the CP pattern and then EURAUD rises and took out those 2 CP pattern.
So EURAUD in uptrend ? @alfonso

http://s24.postimg.org/jrc6r5n51/screenshot_506.png
 
 
  • Commercial Content
  • /
  • Supply and demand in a nutshell by Alfonso Moreno
  • Reply to Thread
    • 1 265266Page 267268269 486
    • 1 Page 267 486
1 trader viewing now
  • More
Top of Page
Forex Factory Blog Updated: Alerting All Members
  • Facebook
  • Twitter
About FF
  • Mission
  • Products
  • User Guide
  • Media Kit
  • Blog
  • Contact
FF Products
  • Forums
  • Trades
  • Calendar
  • News
  • Market
  • Brokers
  • Trade Explorer
FF Website
  • Homepage
  • Search
  • Members
  • Report a Bug
Follow FF
  • Facebook
  • Twitter

FF Sister Sites:

  • Metals Mine
  • Energy EXCH
  • Crypto Craft

Forex Factory® is a brand of Fair Economy, Inc.

Terms of Service / ©2022